Techno-Economic Feasibility Study of a Hypersaline Pressure-Retarded Osmosis Power Plants: Dead Sea–Red Sea Conveyor


Mechanical Engineering Department, Jordan University of Science and Technology, Irbid 22110, Jordan
*
Author to whom correspondence should be addressed.
Energies 2018, 11(11), 3118; https://doi.org/10.3390/en11113118
Submission received: 15 October 2018
/
Revised: 31 October 2018
/
Accepted: 3 November 2018
/
Published: 11 November 2018
(This article belongs to the Special Issue Energy Systems Engineering)
Abstract
:In this study, three pressure retarded osmosis (PRO) power plants are proposed to be built on the Red Sea–Dead Sea (RSDS) water conveyance project, to generate power from the salinity gradient between two water streams at different salt concentrations. The first two proposed plants are to be built after sea water reverse osmosis (SWRO) desalination plants, where Red Sea water and the rejected brine from SWRO plants are used as feed and draw solutions, respectively. In the third proposed plant, Red Sea water and Dead Sea water will be used. Results showed that the three proposed plants are technically feasible while the third plant is the only one that is economically feasible with a 134.5 MW capacity and a 0.056 $/KWh levelized cost of electricity (LCE). The power generated from the third PRO power plant accounts for about 24.7% of the power needed for the RSDS project that can be used to power SWRO-2 in order to reduce the electricity consumption by 49.3%. If the generated power from the proposed PRO plant is sold to the Jordanian national electricity grid at the current selling price in accordance with Jordanian prices of electricity, a saving of about 21.2% can be attained. It is found that using the power generated by the current proposed plants for desalination project purposes will significantly reduce the price of desalinated water produced from SWRO desalination plants.
1. Introduction
Blue energy is one of the renewable energy sources that has a great potential to generate power by mixing two solutions of different salt concentrations. One of the most widely investigated processes to harvest the salinity gradient power is pressure retarded osmosis (PRO). Increasing demand on traditional energy sources, such as fossil fuels, encouraged researchers to search for other sources of energy, such as renewable energy and alternatives, especially after the oil crises in 1973, 1990, and 2000s, and the Kyoto protocol in 1997.
Renewable energy sources, such as solar and wind, are non-dispatchable due to its fluctuating nature. They depend on the availability of solar radiation, wind speed, and other factors, therefore the reliance on them is limited without the support of proper energy storage systems, which still have a low efficiency and high cost. Osmotic power (blue energy) is one type of dispatchable renewable energy sources that can generate power continually. It is estimated that the global potential of osmotic power from flowing rivers into the seas is calculated to be two TW, about 980 GW of which can be harnessed [1,2].
The concept of generating power by mixing salt and fresh water was first introduced in 1954 [3]. Succeeding the oil crises in 1973, the term pressure retarded osmosis (PRO) was introduced and followed by a series of theoretical and experimental investigations by Loeb et al. [4,5,6,7,8,9]. They studied the technical and the economic feasibility of mixing freshwater with seawater by using a hollow-fiber reverse osmosis (RO) membrane where fresh water flows through the bore and the seawater flows on the active layer side of the membranes. Their results show that the seawater reverse osmosis membranes that were designed for water desalination are not suitable for PRO applications because of the thick support layer and their hydrophobicity. Since then, the RO membrane has developed into a thinner support layer with decreased hydrophobicity [10].
Generating osmotic energy from a sea water/river water resource scheme is the most known and studied scheme [11,12,13,14]. However, the power density and water flux based on this scheme is not viable with present commercial PRO membranes because of their limited water permeability and the thick support layer that significantly reduces the osmotic pressure difference [15]. Conversely, studies on generating osmotic energy from hypersaline water bodies are very limited because of their scarce availability and the presence of the logistics and geographical constraints. This scheme produces higher osmotic pressure differentials and hence increases the water flux and the power density of the system. In this scheme, sea water could be used as a feed solution mixed with higher concentrated brine as a draw solution. Some studies investigated this way to exploit the osmotic energy from the brines of desalination plants [16,17,18], and hypersaline water from salt lakes [11,13,19,20,21,22].
Exploiting osmotic energy using the PRO process from hypersaline water resources requires membranes with a high hydraulic operating pressure to withstand the high osmotic pressure difference. Current available PRO membranes can operate on a maximum pressure difference of 13 bar, which is far below the required operating pressure for hypersaline PRO power plants, as in this study, while RO membranes can withstand pressures up to 120 bar [23]. Experimental results available from using RO membranes in hypersaline PRO applications are very limited. The first experimental study was conducted by Mehta and Loeb in 1978 using an RO aromatic polyamide hollow fiber membrane [7,8,9] and they reported that the actual power generated was far below the expected theoretical potential where the water flux extremely decreased after two hours. They reported an operating pressure of 40.5 bar, power density of 3.3 Wm−2, and water flux of 2.92 Lm−2h−1. Current RO membranes have shown a huge improvement over the last few decades in terms of water flux, operating pressure, and cost [14]. Efraty [24] used a modified commercial thin film composite (TFC) RO membrane SW30-HR reported in Reference [15]. He reported that pairing river water with hypersaline domains (33% NaCl) under an operating pressure of 92.5 bar will yield a power density of 696 Wm−2 and a water flux of 712 Lm−2h−1.
The idea of generating power using a PRO process from the Dead Sea was first introduced and investigated by Loeb [21]. Using a hollow fiber RO membrane by mixing sea water with the Dead Sea water and a concentrated brine RO desalination plant with the Dead Sea, his finding shows the technical feasibility of generating 130 MW and 48 MW PRO power plants, respectively, and the economic feasibility of the energy cost was 0.058 $/KWh and 0.07 $/KWh, respectively. However, Loeb’s findings were idealistic based on assumed water inflows and a suboptimal RO membrane in 1998. Furthermore, Loeb’s economic analysis was based on RO desalination plants at that time.
In this study, we analyze possible scenarios to exploit osmotic energy for power generation using a PRO process from the on-going Red Sea–Dead Sea Water Conveyance Project (RSDS) [25] based on the available data from the project and a recent modified commercial RO membrane [15]. This study also examines the techno-economic feasibility of these scenarios and their potential to power the RO desalination plants that will be built in this project.
Presently, there is no PRO plant for commercial use built. The first PRO prototype power plant with a 2 kW capacity was built by Statkraft in Norway in 2009 for research purposes. The plant utilized 13 L/s of river water and 20 L/s of seawater with a 2000 m2 membrane [25]. The prototype proves that the PRO process can be implemented at a large scale for power generation purposes.
In the present study, three PRO power plants are proposed to be built in the RSDS project. The RSDS project planned to be built in the next few years is as mentioned in the memorandum of understanding that has been signed in 2013 between the countries bordering the Dead Sea [25]. The first PRO power plant inflows are Red Sea water as a feed solution and the first sea water reverse osmosis (SWRO) plant brine is used as a draw solution. The second PRO power plant inflows are the diluted water from the Red Sea and the first SWRO plant brine is used as a feed solution, and the second SWRO plant brine is used as a feed solution. The third PRO power plant inflows are the diluted water from the second PRO as a feed solution and the Dead Sea water is used as a draw solution. All economical and technical aspects related to the design of the PRO power plants are considered in this study including the pumping system, membranes, turbine-generator set, pressure exchangers, and the pre-treatment system.
2. Materials and Methods
2.1. Red Sea–Dead Sea Water Conveyance Project
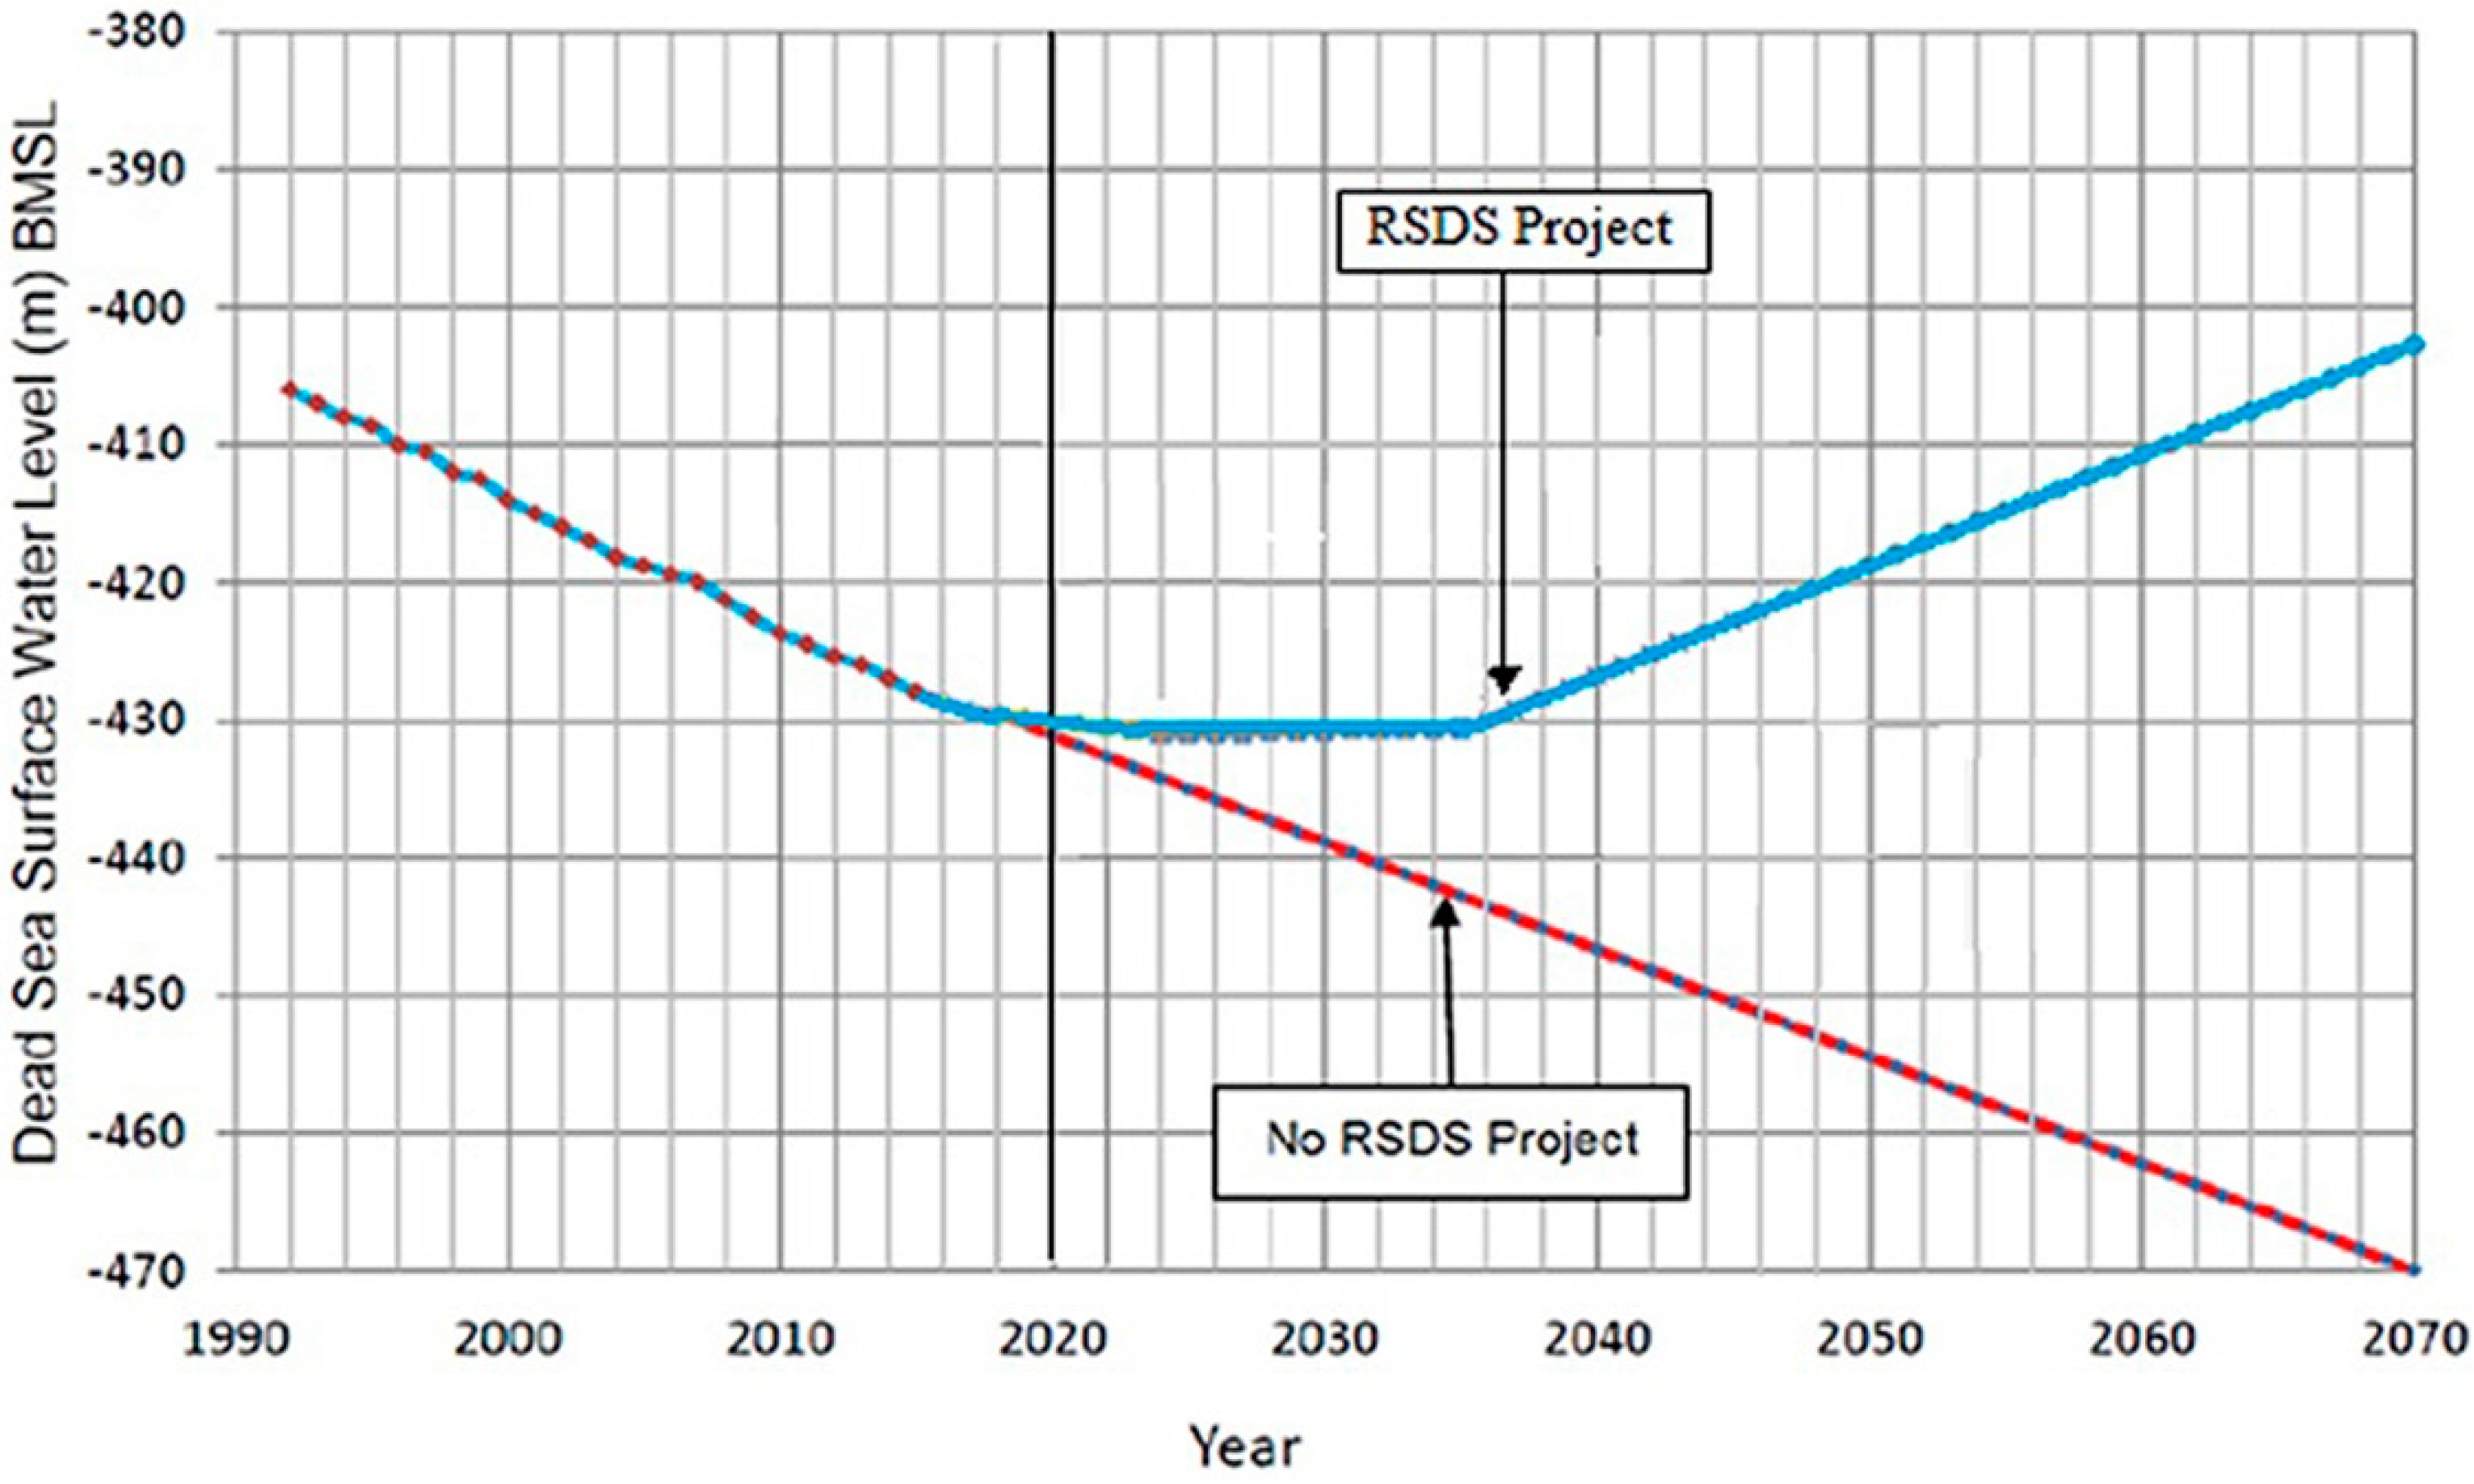
The Dead Sea is considered the lowest spot on earth, more than 400 m below sea level. It is one of the saltiest water bodies in the world; its water is ten times more saline than ocean water. The Dead Sea and its unique environment are changing, as the water level is dropping due to a significant evaporation rate (754 MCM/year), consumption of Dead Sea water as a raw material for the chemical industries (650 MCM/year), and the diversion of about 85% of the Jordan River [25], which is the main water body feeding the Dead Sea. Consequently, this means a reduction in the surface area of over 3 km2 per year and dropping water level about 1 m per year. As a result, water level has fallen from 394 m below sea level in the 1960s to about 427 m below sea level at the end of 2014 [26]. If no action is taken to remedy the situation, the Dead Sea will reach a new level at an elevation that is about 40 m below the current level, as can be seen in Figure 1. The further decline of the Sea’s level is likely to cause more severe environmental, economic, and cultural damages [25].
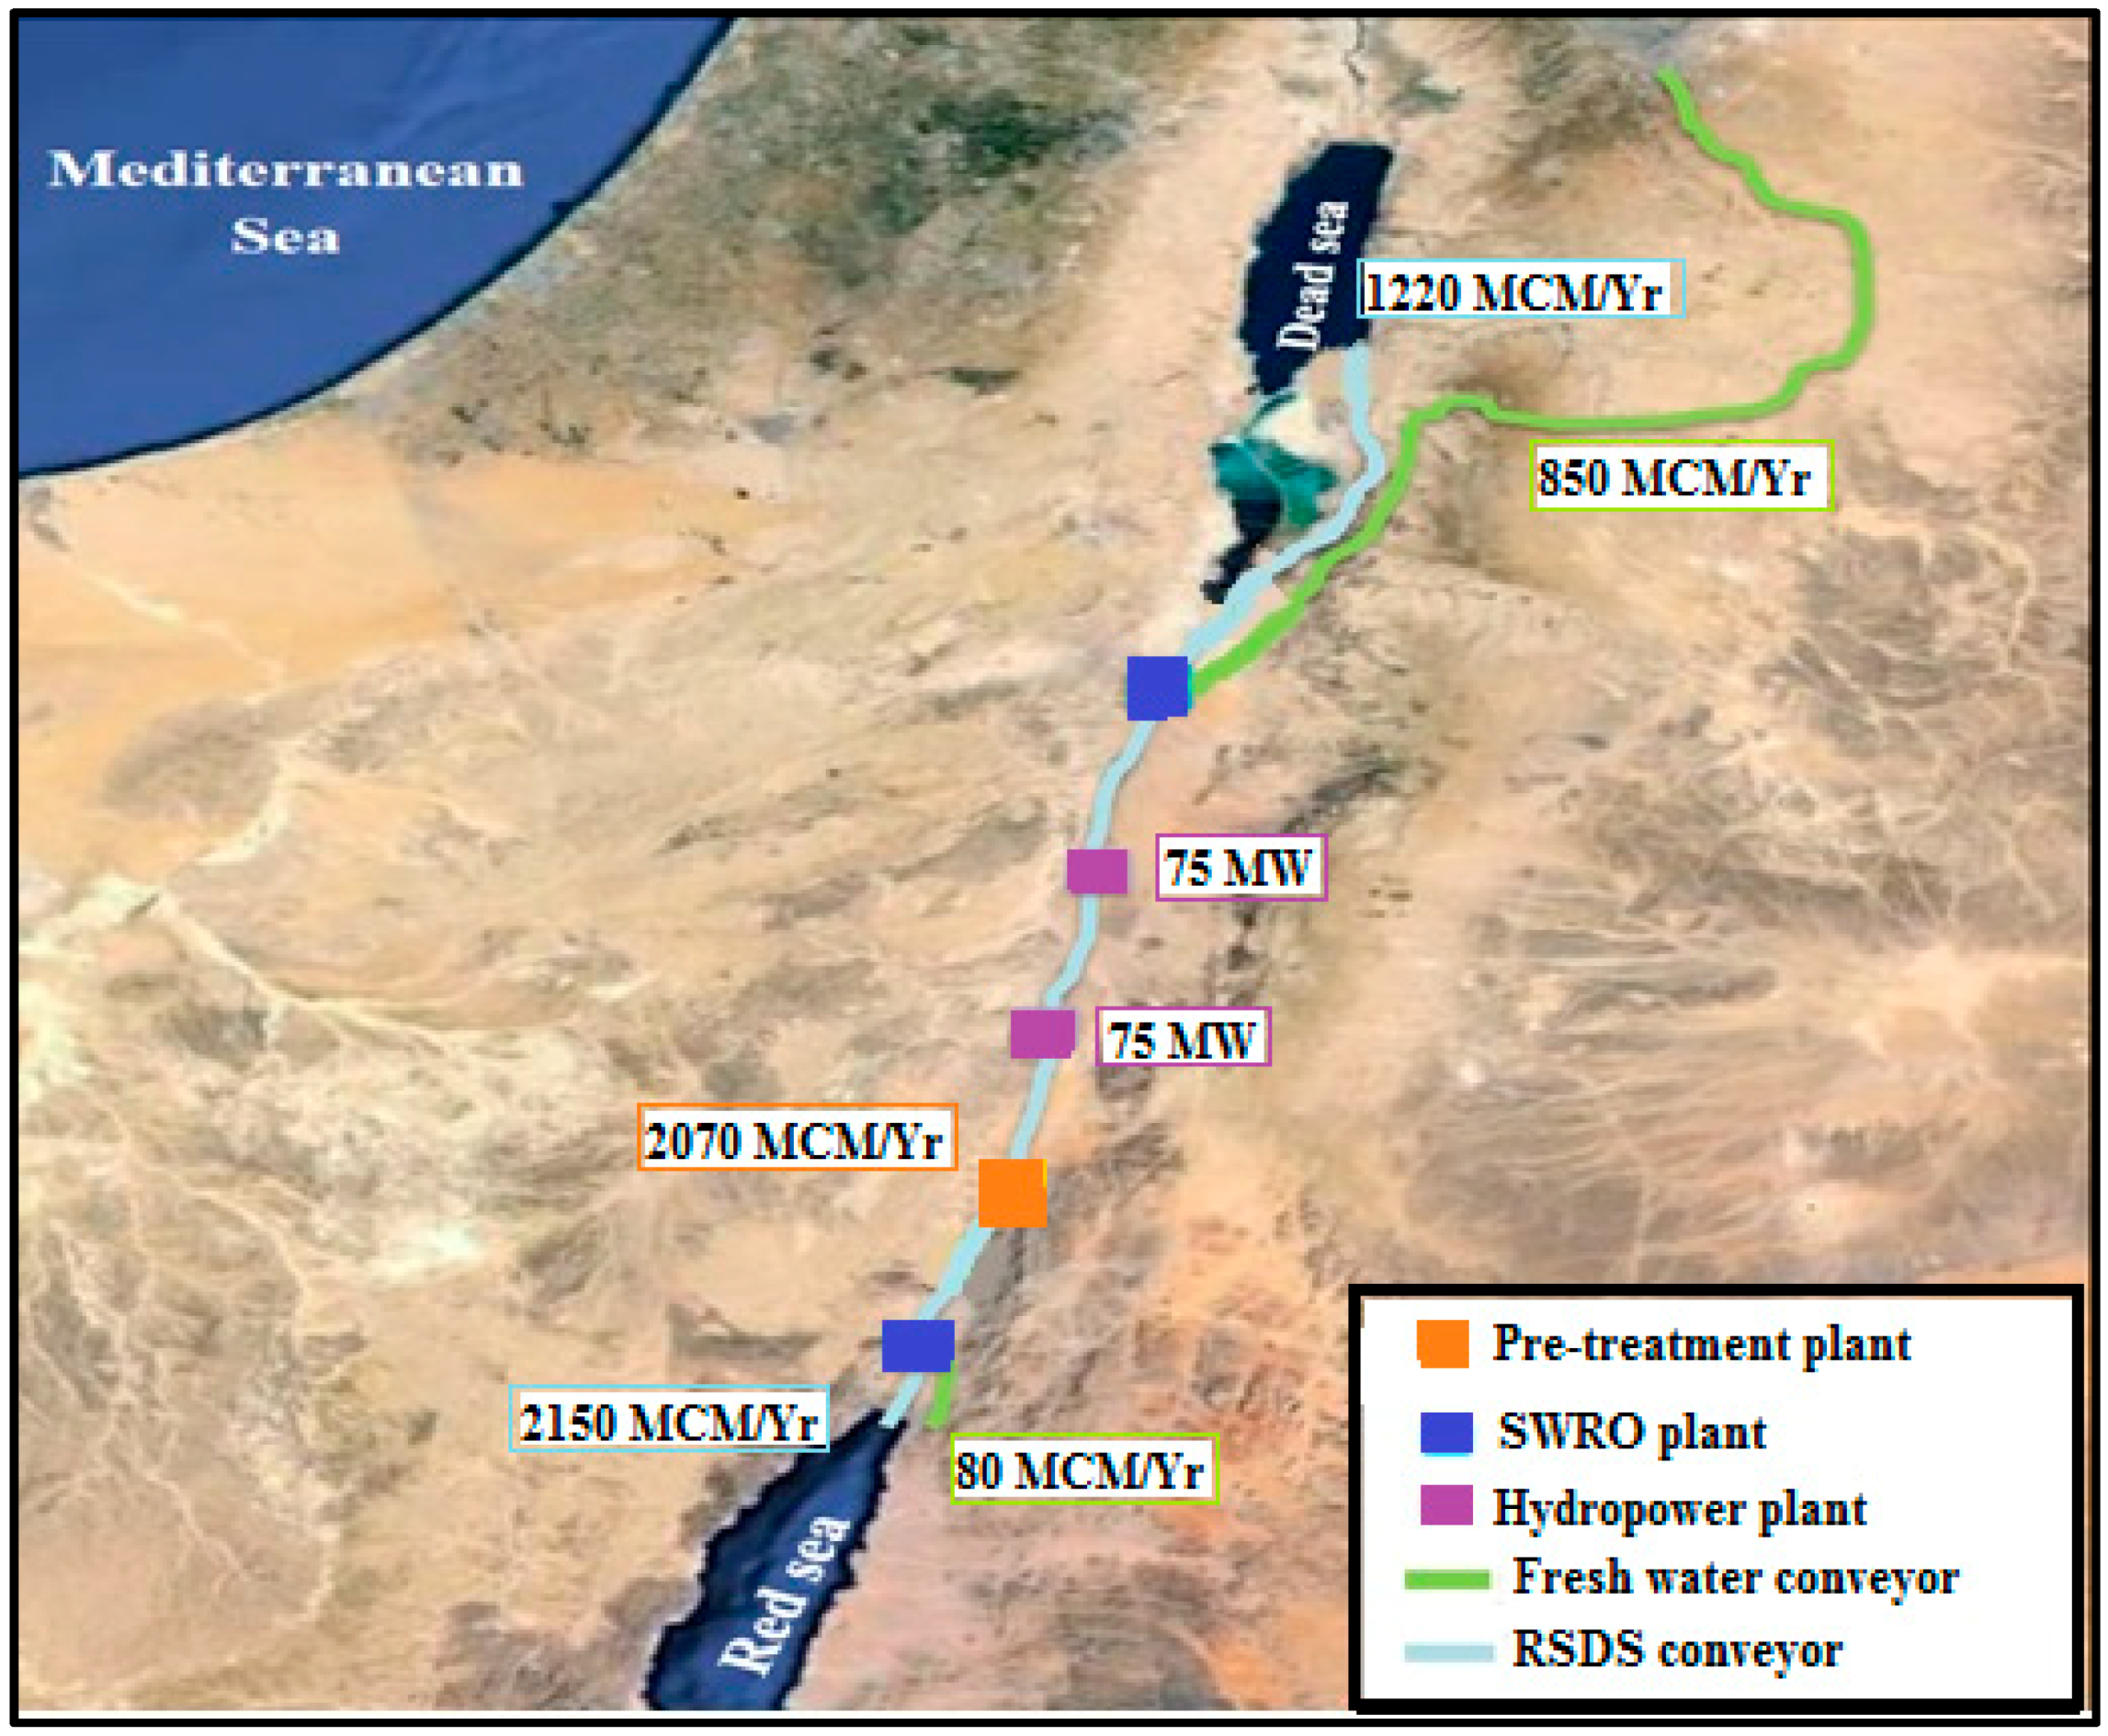
The big difference in elevation between the Dead Sea and the Red Sea has long been attractive to build a water conveyance project because of the gravity flow advantage and the considerable potential for hydropower generation. In 2013, the three Dead Sea bordering countries signed a memorandum of understanding to start implementing the Red Sea–Dead Sea project (RSDS). The proposed project is a water infrastructure project designed to convey about 1220 MCM of Red Sea water to the Dead Sea annually in order to provide the beneficiary countries bordering Dead Sea with potable water and to save the Dead Sea from environmental degradation by increasing Dead Sea water level from −428 m up to −406 m [25].
The proposed project infrastructure includes two large-scale sea water reverse osmosis (SWRO) desalination plants with a total capacity of 930 MCM of fresh water annually, two hydropower plants with total 150 MW power capacity, a pre-treatment plant, and pump stations (Figure 2).
The proposed RSDS project is designed to allow a phased implementation schedule. In the first phase, a SWRO-1 plant will be constructed over the next few years to provide beneficiary countries with 80 MCM of fresh water. The second and third phases are planned to cause a stabilizing effect on the Dead Sea water level, and the last two phases are introduced to increase the water level as shown in Figure 2. The two hydropower plants, pretreatment system, and SWRO-2 plant will be built during these phases.
2.2. PRO Power Plant Modeling
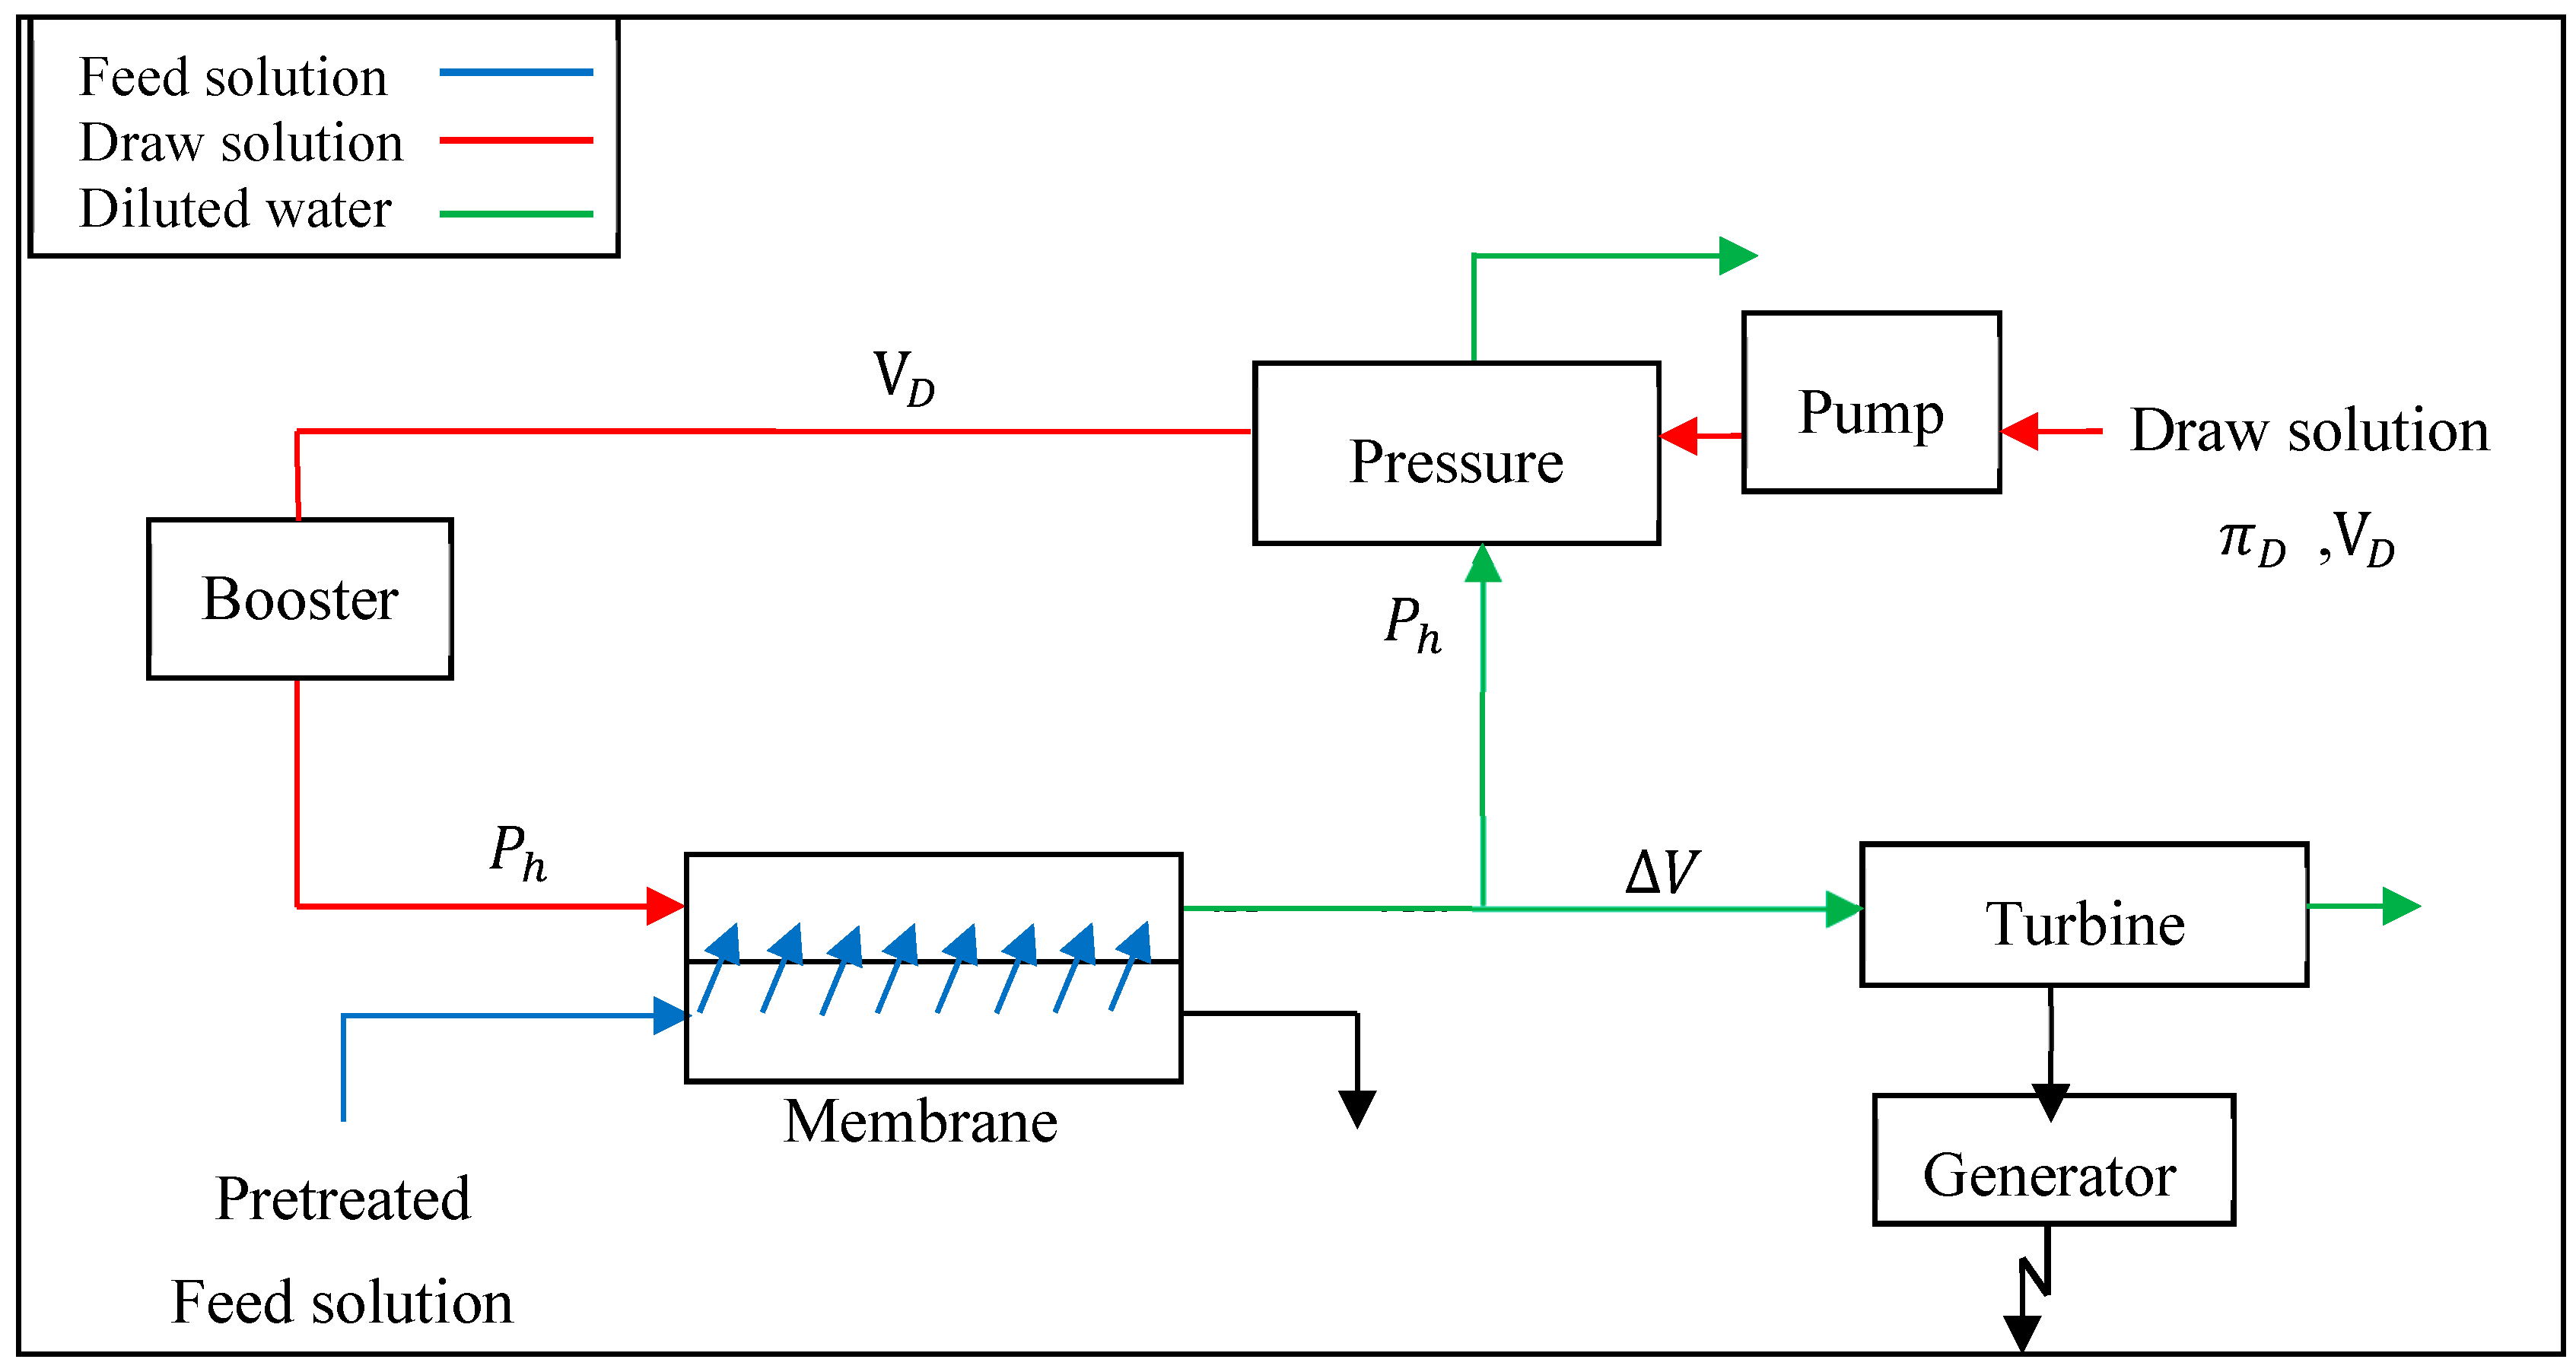
In the PRO plant, a draw solution with a volumetric flow rate of VD and osmotic pressure πD is pressurized to a hydrostatic pressure Ph using pumps. The feed solution enters the membrane vessel with a volumetric flow rate VF. As πD is larger than the feed solution osmotic pressure, πF, the draw solution permeates through the membrane to the high concentration side at a ΔV volume flow rate (Figure 3). As a result, the volume flow rate of the draw solution increases. This pressurized solution is split into two flows: 2/3 of the flow will drive the pressure exchanger, and the rest will drive the hydro turbine to generate power [27]. A pressure exchanger was found to be the best option in the PRO plant as an energy recovery device. It was proved that pressure exchangers can save about 60% of the energy input in SWRO desalination plants [28].
Osmotic pressure, π, of a solution can be determined using the Van’t Hoff equation [14]:
where Φ is the osmotic reflection coefficient, I is the ionic concentration per dissociated solute molecule, c is the molar concentration of the salt ions (mol/L), R is the gas constant (0.08314472 L·bar/K·mol), and T is the temperature (K).
The concentration of salt in hypersaline water sources is 240–340 g/L [14]. Using the Van’t Hoff equation and the data in Table 1, the estimated osmotic pressure of the Dead Sea as a hypersaline water source is found to be 240 bar at 293 K. This result is compared to 225 bar as estimated by Kelada [29].
For oceans around the globe, NaCl is the dominant salt and its concentration ranges between 30 to 40 g/L (3–4%) [11]. Meanwhile, the Red Sea salinity ranges between 4.2 and 4.5%, since it is located in a desert zone with high evaporation rate [25]. Using the Van’t Hoff equation with 4.44% salinity (44.4 g/L) at 293 K, the osmotic pressure is calculated and found to be 34.4 bar. An approximation for π may be made by assuming that 1 g/L of total dissolved solids (TDS) equals about 0.76 bar of osmotic pressure. This approximation was used to calculate the osmotic pressure of RSDS conveyance water shown in Figure 4.
In this study, three PRO power plants are proposed. The first plant is proposed to be built after SWRO-1 where the flow intakes are the Red Sea water and the first SWRO brine. For the second PRO plant, proposed to be built after SWRO-2, the flow intakes are the treated water and the second SWRO brine. The third one is before the Dead Sea where the flow intakes are the final Red Sea mixed flow with Dead Sea water, as shown in Figure 4.
The draw solution flow rates, VD, and feed solution flow rates, VF, were determined based on the Jordan Red Sea Project report [26], which is explained in Figure 5. The feed solution flow rate, VF, for PRO 1 is calculated based on a recovery rate of 50%, which will permeate through the membrane because of the limited amount of draw solution that enters the plant, while in PRO 2 and PRO 3, flow rates are fully used as the feed solution since larger amounts of draw solution flow rates are entering these plants. The permeated flow rate through the membrane, ΔV, for the three proposed PRO plants is calculated based on a desirable (VD/ΔV) ratio in PRO plants [14].
Since the streams entering and leaving SWRO and PRO plants are always mixed, the TDS values are always changing. To determine the osmotic pressure (π) for the feed and draw solutions of the three PRO plants, TDS must be known. This can be achieved by knowing the flow amounts as shown in Figure 5, and the TDS of the Red Sea, which is equal to 44.4 g/L, and the TDS of the desalinated water, which is approximately negligible.
For example, the draw solution of the first PRO plant is the brine from SWRO-1. This is equal to 80 MCM/yr. The water entering the SWRO-1 is Red Sea water at rate of 160 MCM/year, and the desalinated water is 80 MCM/year. Therefore, the brine TDS is 44.4 g/L × 2 = 88.8 g/L, and π = 88.8 × 0.76 = 67.5 bar. The calculated results of the feed, draw, and permeate solutions flow rates as well as feed and draw osmotic pressures of the three proposed PRO power plants are presented in Table 2.
For steady power generation, steady flow has to be maintained. To do so, the hydrostatic pressure difference ΔPh and osmotic pressure difference Δπ must be kept constant. Equation (2) shows the mathematical expression for the flow through membrane [31]:
where Jw is water flux (m3/m2·s), and A is the water permeability coefficient of membrane (m3/m2·s·bar). Power density, W, is the power generated per unit area membrane (W/m2), mathematically:
The optimum hydrostatic pressure that should be applied is . Therefore, the maximum power density, Wmax, is:
The maximum power, PWmax, for 100% efficiency mechanical components and without considering any losses and parasitic power consumption is:
The actual power output of a PRO plant depends on the non-ideal performance of the different components that are used and on the parasitic energy losses. These components are the:
- Membrane
- Mechanical components like turbines, pumps, pressure exchangers, and generators.
- Piping system
- Pre-treatment system.
2.2.1. Membrane
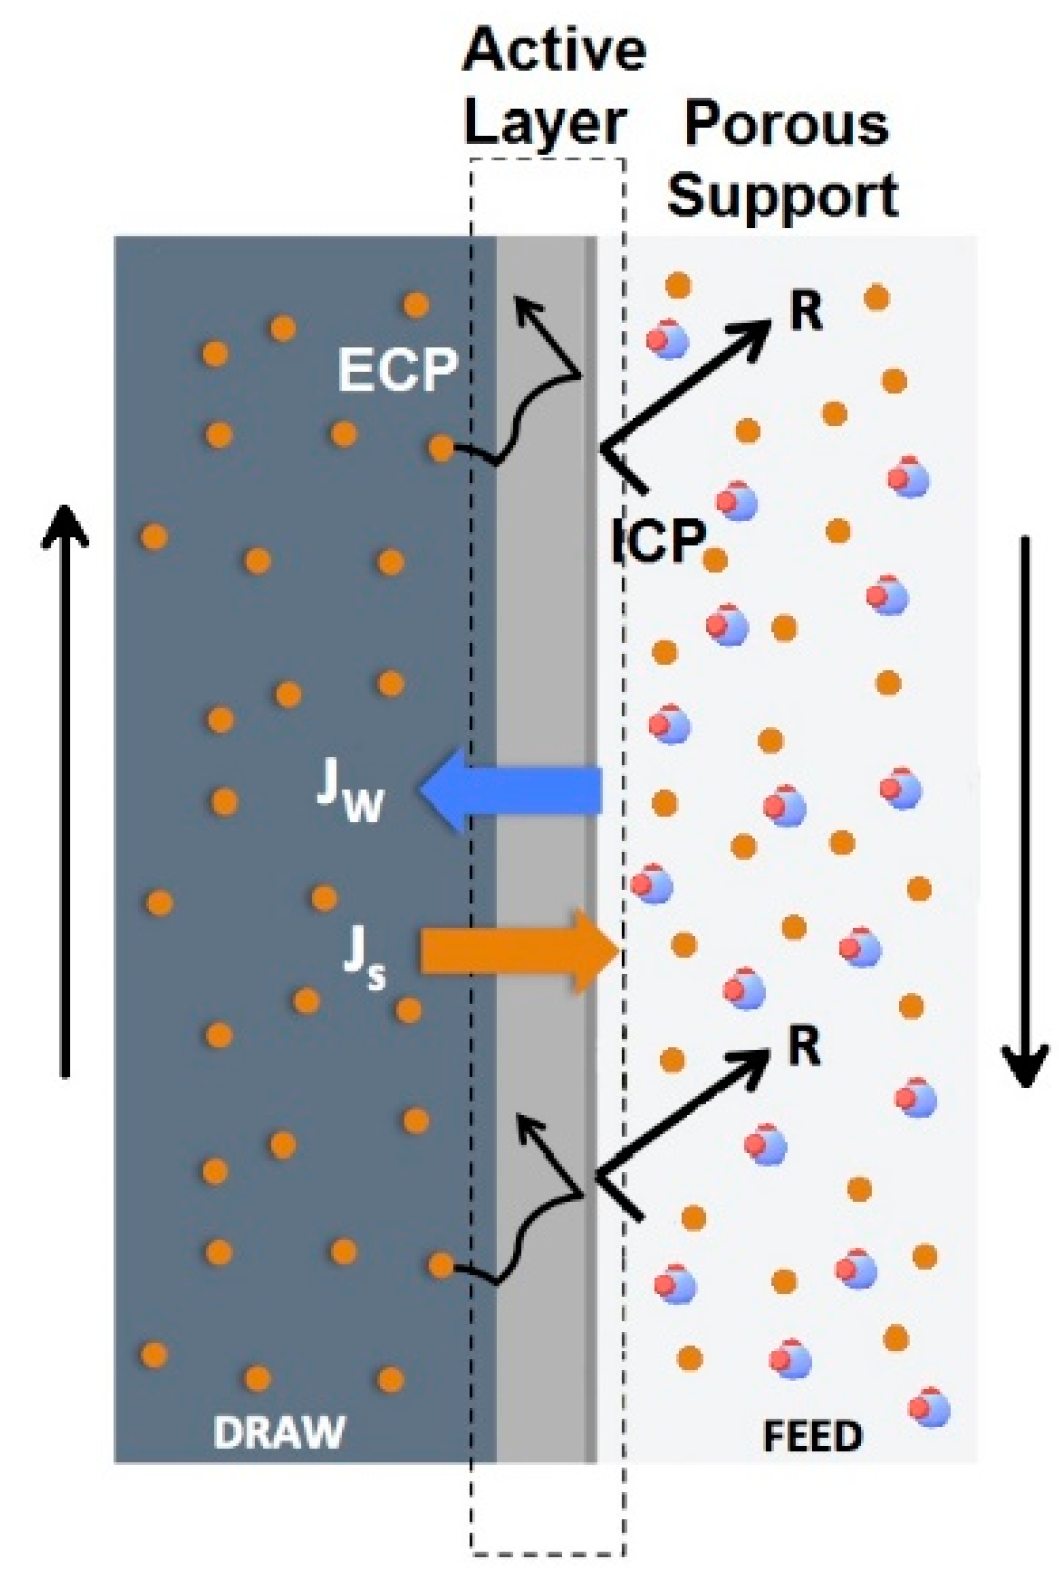
The most critical step in the designing of PRO plant is selecting the proper type of membrane. The actual performance of the membrane depends on different factors. One of the most important factors that reduces the performance of membrane is the concentration polarization that occurs at the boundary layer of the membrane due to accumulation of salts. Membranes are composed mainly of an active layer and porous support layer. The active layer is used to separate water and salt (0.1 to 2 µm), whereas the support layer provides strength to withstand the high pressure and is much thicker than the active layer. Accumulation of salts on the feed solution side is called internal concentration polarization (ICP) and it is a function of the support layer thickness, porosity, and tortuosity [15]. Accumulation on the draw solution side is called external concentration polarization (ECP); thus, the actual membrane performance occurs at the active layer, as shown in Figure 6.
Another important factor that also reduces membrane performance is the reverse salt flux, , where small amount of salt flows through the membrane from the draw solution to the feed solution. To study the non-ideal effects of the membrane, some information about the membrane structure (i.e., thickness, porosity, and tortuosity) should be known under test conditions.
Membranes for such applications should withstand high pressures. The optimum hydrostatic pressure that will be used to pressurize the draw solution, , is half of osmotic pressure difference , as mentioned in Table 4. However, PRO membranes are designed to withstand hydrostatic pressure up to 15 bar, since it is used for river water and seawater applications (i.e., ≤ 30 bar) [14]. Such operating pressure is not suitable for very high PRO applications, as in the current study.
Most seawater RO membranes operate at the range of 55–83 bar at a feed solution concentration of 32 g/L [11]. Yet, high pressure membranes are specially manufactured to operate at higher pressures up to 120 bar and higher feed solution concentrations up to (58–87 g/L) [23]. In this study, seawater RO membranes are used to withstand the high osmotic pressure difference (240 bar) calculated using Equation (1). Such membranes are designed for a brine conversion SWRO process. Using RO membranes for PRO applications was first investigated by Loeb et al. [4,5,6,7,8,9]. They concluded that using RO membranes for PRO applications reduce the water flux significantly because of the internal concentration polarization.
However, in the last decade, the idea of using RO membranes for PRO applications has been raised again and investigated by chemically modifying the active layer of commercial RO membranes. Such studies are very limited and still under research and development [13,14,15,24,33]. The selected membrane in this study is a commercially modified RO polyamide thin-film composite membrane TFC-RO SW30-HR [15]. This membrane is chemically modified to be used for PRO application at higher pressures. The characteristics of this membrane are listed on Table 3. Despite there being other RO membrane options commercially available that withstand higher pressures than SW30-HR, these membranes are not modified for PRO applications, and their characteristics and intrinsic values under test conditions are not available for public. However, the SW30-HR membrane is found to be the only RO membrane in the literature modified to work under PRO applications. Efraty [24] used the SW30-HR membrane in a closed-circuit PRO. He reported that pairing river water with hypersaline domains (33% NaCl) under an operating pressure of 92.5 bar will yield a power density of 696 Wm−2 and a water flux of 712 Lm−2h−1.
This type of membrane was assumed to be a good choice for the PRO plant since it was approved for such conditions in PRO mode. In PRO mode, unlike RO mode, the active layer of membrane faces the draw solution side (high concentration), which means more salt accumulation that increases the ECP. ICP was assumed to have no effect on membrane performance because the properties of the membrane in Table 3 shows the membrane performance in RO mode, i.e., the water in the feed solution side of Figure 6 is brine that will be desalinated in RO mode, which is similar to the case in PRO.
The other factor that reduces the output power from the PRO plant is the pressure drop in the membrane elements. The power losses in membrane elements due to the pressure drop can be described using Equation (6). Assuming four elements will be in each pressure vessel, then, the total pressure drop is 4 bars.
The amount of permeated water through membrane is given by:
The equation above is used to calculate the membrane area . The power density of the membrane for the three PRO plants is shown in Table 4.
2.2.2. Mechanical Components and Piping System
The inefficiencies of mechanical components and the pressure drop in the piping system reduce the output power from the PRO plant. The pressure drop in the piping system due to friction in the pipe and fittings is assumed to be 1 bar. The capital cost of the piping system is assumed to be 1% of the capital cost of the PRO plant [34].
Turbines used in PRO plants are impulse turbines, such turbines are used for high head and low flow rate applications. A Pelton turbine is the best to be used in PRO power plants [35].
Equation (8) is an empirical formula that is used to calculate the cost of a Pelton turbine-generator set [36].
where represents the number of turbine and generator sets that can be known from and flow rates, represents the water flow rate entering one turbine that can be known from the flow rate that will enter the turbine, is the total hydraulic head of water entering Pelton turbine i.e., (), and is the Pound to U.S. Dollar conversion factor. These data for each PRO power plant are given in Table 5.
Power loss due to inefficiencies of turbines and generators can be described using Equation (9):
The efficiency of a Pelton turbine can reach up to 97% [37], and the generator efficiency can also reach up to 98%. Therefore, the total efficiency of a turbine generator set is 95%. Table 6 represents the power loss of a turbine generator set for the three plants.
The use of pressure exchangers reduces the consumption power in the plant. Pressure exchangers have high efficiencies up to 97% [38], and Equation (10) can be used to estimate the capital cost of pressure exchangers [39]:
The pressure drop in the pressure exchanger due to the inefficiency is given by Equation (11). This pressure drop will be compensated by the use of a booster pump.
2.2.3. Pre-Treatment System
In any membrane system, fouling is considered a key issue that affects the productivity and costs [14,41]. Water entering PRO power plant contains different types of colloidal, suspended, soluble, and organic matter. The accumulation of this matter on the membrane causes fouling, especially on the feed solution side as it faces the porous support layer. Thus, a pre-treatment system is important to sustain the membrane performance for long periods. The energy applied for a pre-treatment system reduces the net power from the plant. Moreover, the pre-treatment will add an additional capital cost. Based on the Stat Kraft field test [41], micro-filtration was considered as a good option for the pre-treatment of water in PRO plants. The pre-treatment system capital cost can be estimated using Equation (18), where the micro-filtration cost factor is 0.1 €/m3 [41]:
The symbol represents a scale factor, and in the case of a PRO plant, the relationship between the plant capacity and the flow rate through the pre-treatment facility is linear. Thus, the scale factor is equal to 1. F represents the Euro to U.S. Dollar conversion factor and represents second to year conversion factor. The total power consumption of pre-treatment system can be calculated using the following equation [42].
where represents minimum pressure of micro-filtration in pre-treatment system.
3. Results and Discussion
To calculate the net output power PWnet from the PRO plant, power losses and parasitic power consumption are subtracted from the maximum theoretical power:
The capital cost of the plant is the sum of all components cost as shown in Equation (21):
Table 6 presents the results of the modeled PRO plant capacity, with the maximum theoretical power of the plant calculated using Equation (4).
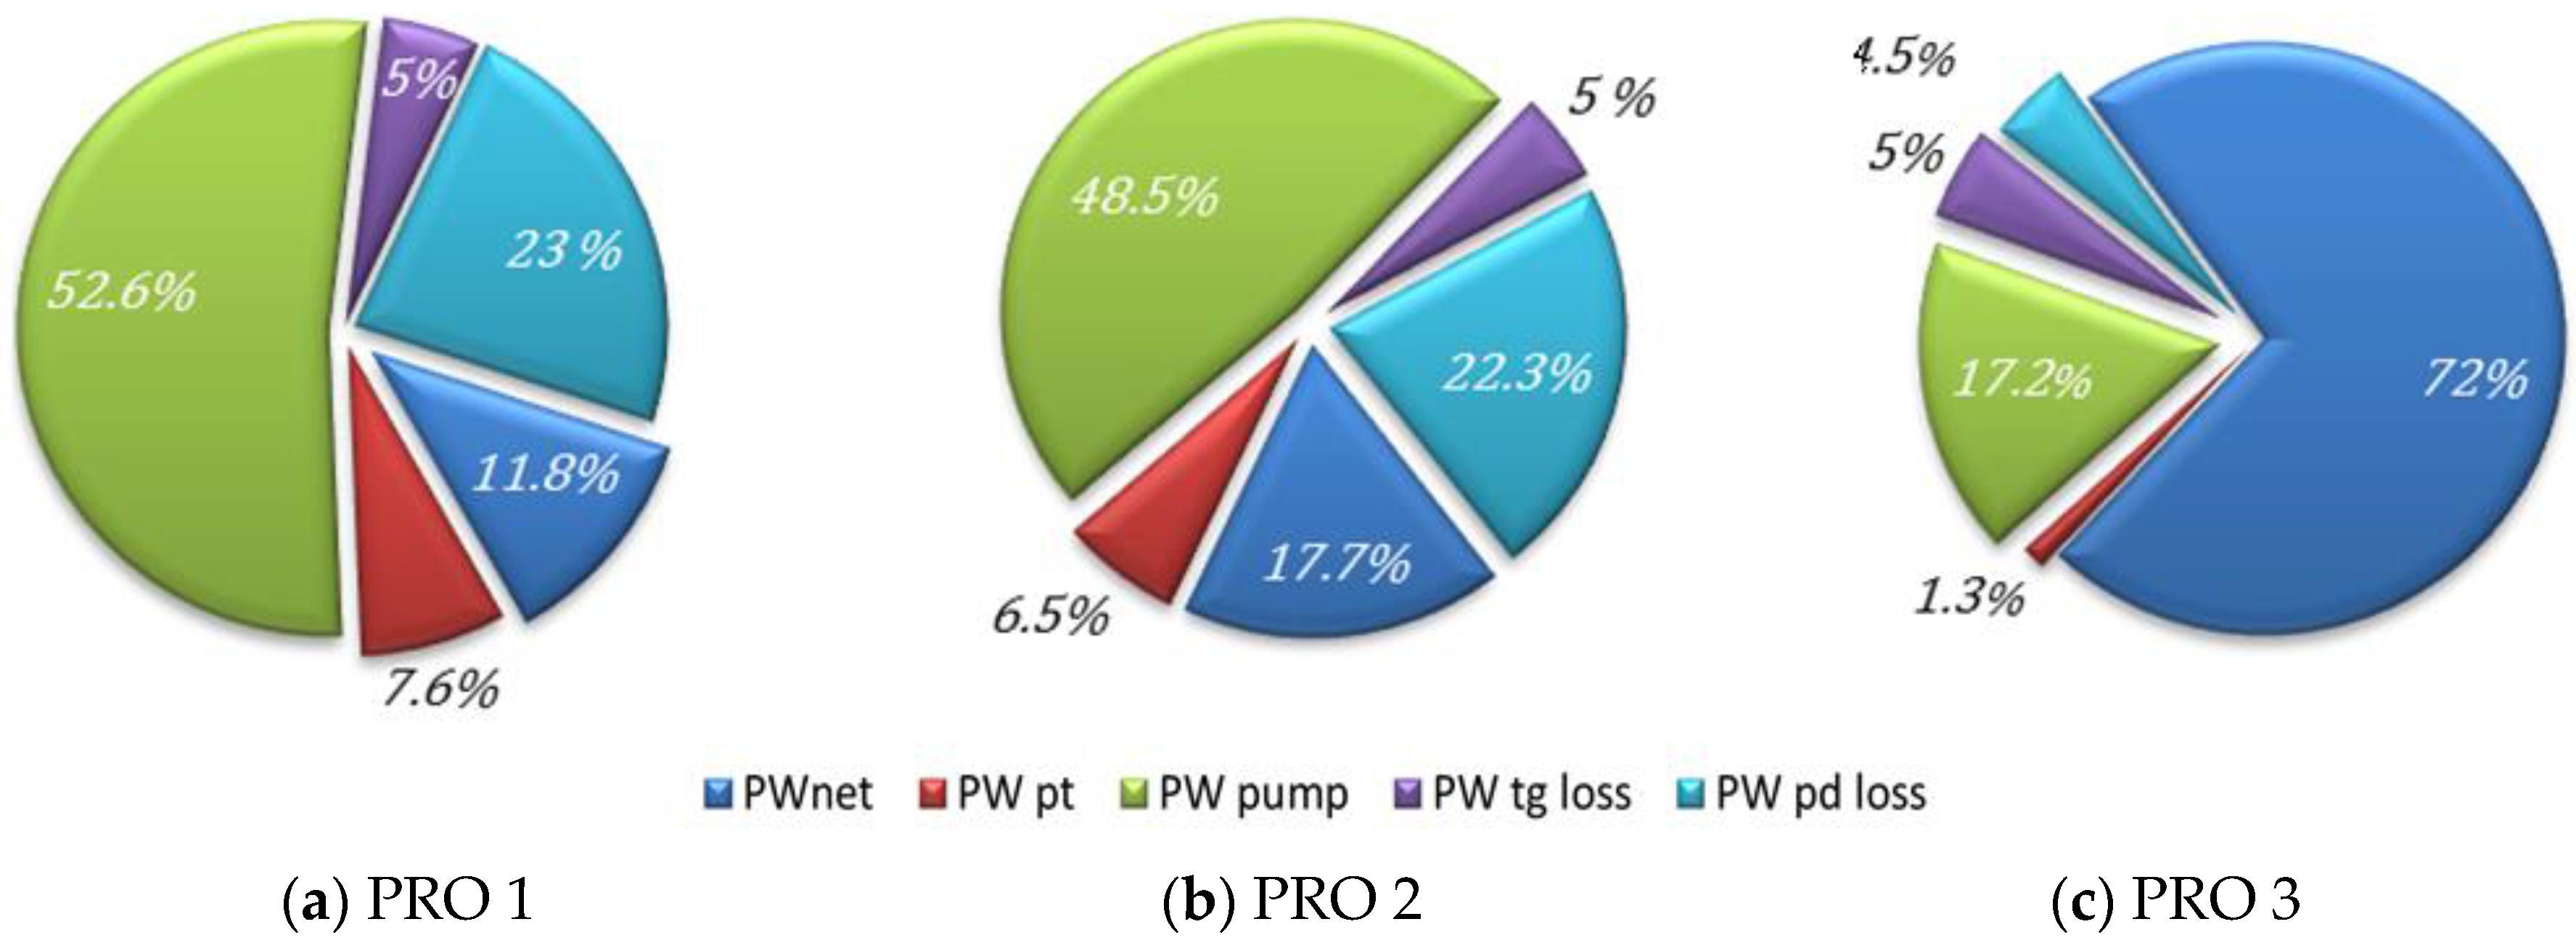
Results show that the first and second PRO plants have low efficiency, since the osmotic pressure difference is low and the SWRO membrane designed for brine desalination has a low water permeability coefficient compared to other PRO membranes.
Furthermore, the power needed for pumping in these two plants is considerably high compared to generated power, which is about 40%, as illustrated in Figure 7. However, calculated results for the third PRO power plant show that the plant can generate 1.178 TWh per year, which is about 6% of the total electrical consumption in Jordan [43]. The plant efficiency is 74.5%, which is better than thermal and renewable power plants, except hydropower plants [35].
The capital cost of the membrane, piping system, turbine generator set, pressure exchangers, pumps, and pre-treatment system are shown in Table 7.
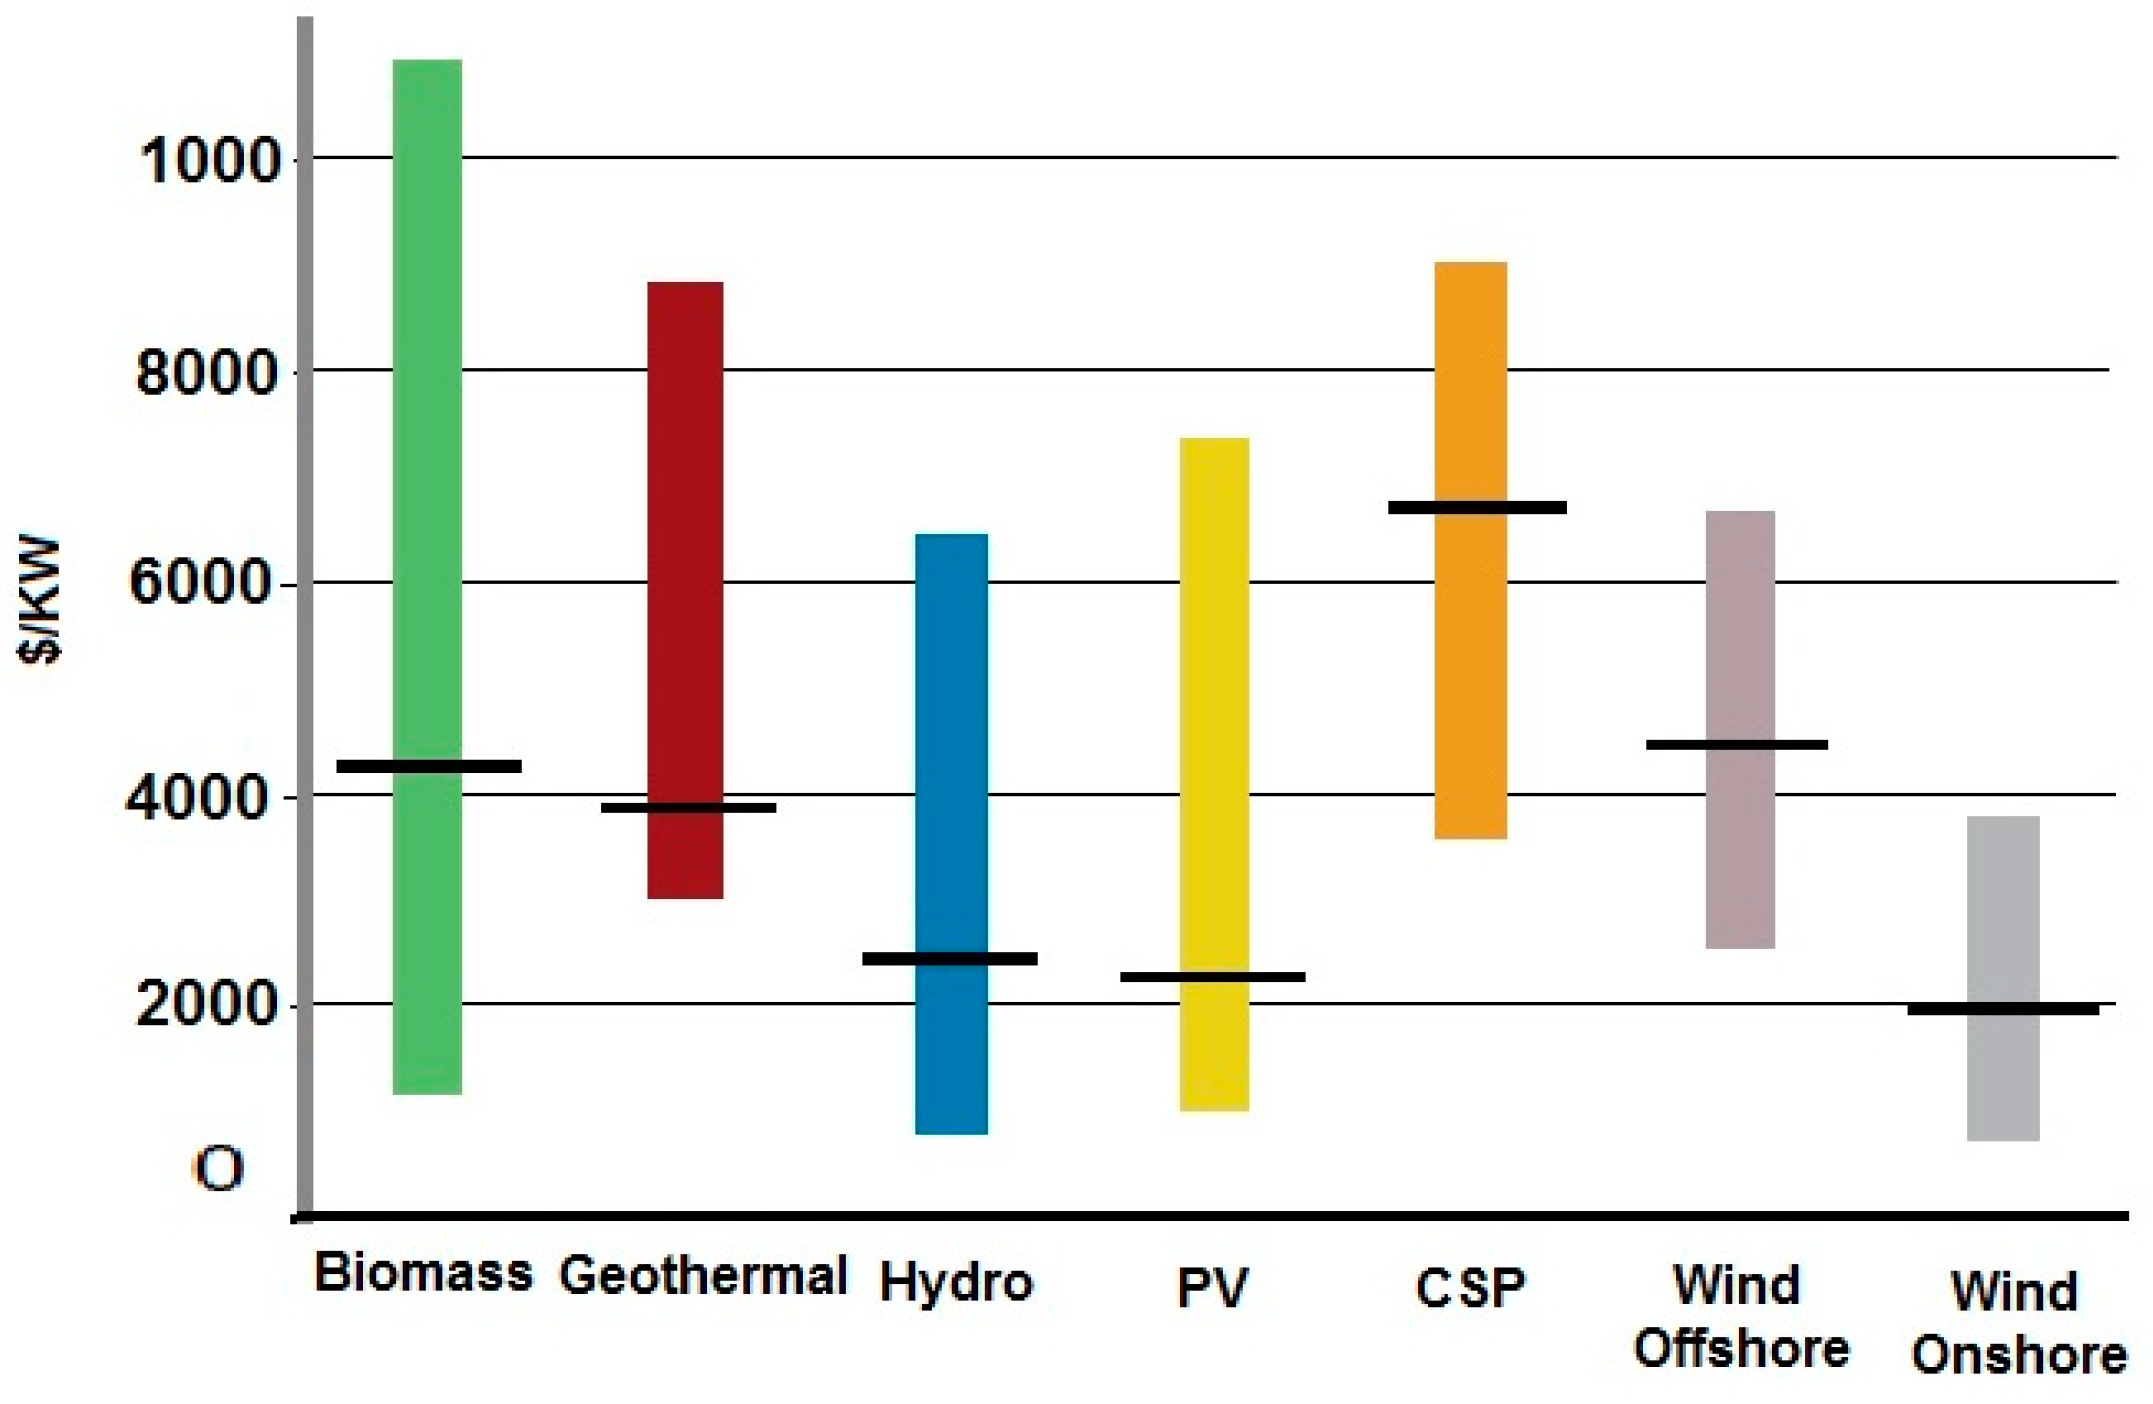
Capital costs for the three power plants per unit of KW installation indicate that the first and second PRO power plants are not economically feasible compared to other types of renewable power plants. In contrast, the third PRO power plant is highly competitive, as shown in Figure 8.
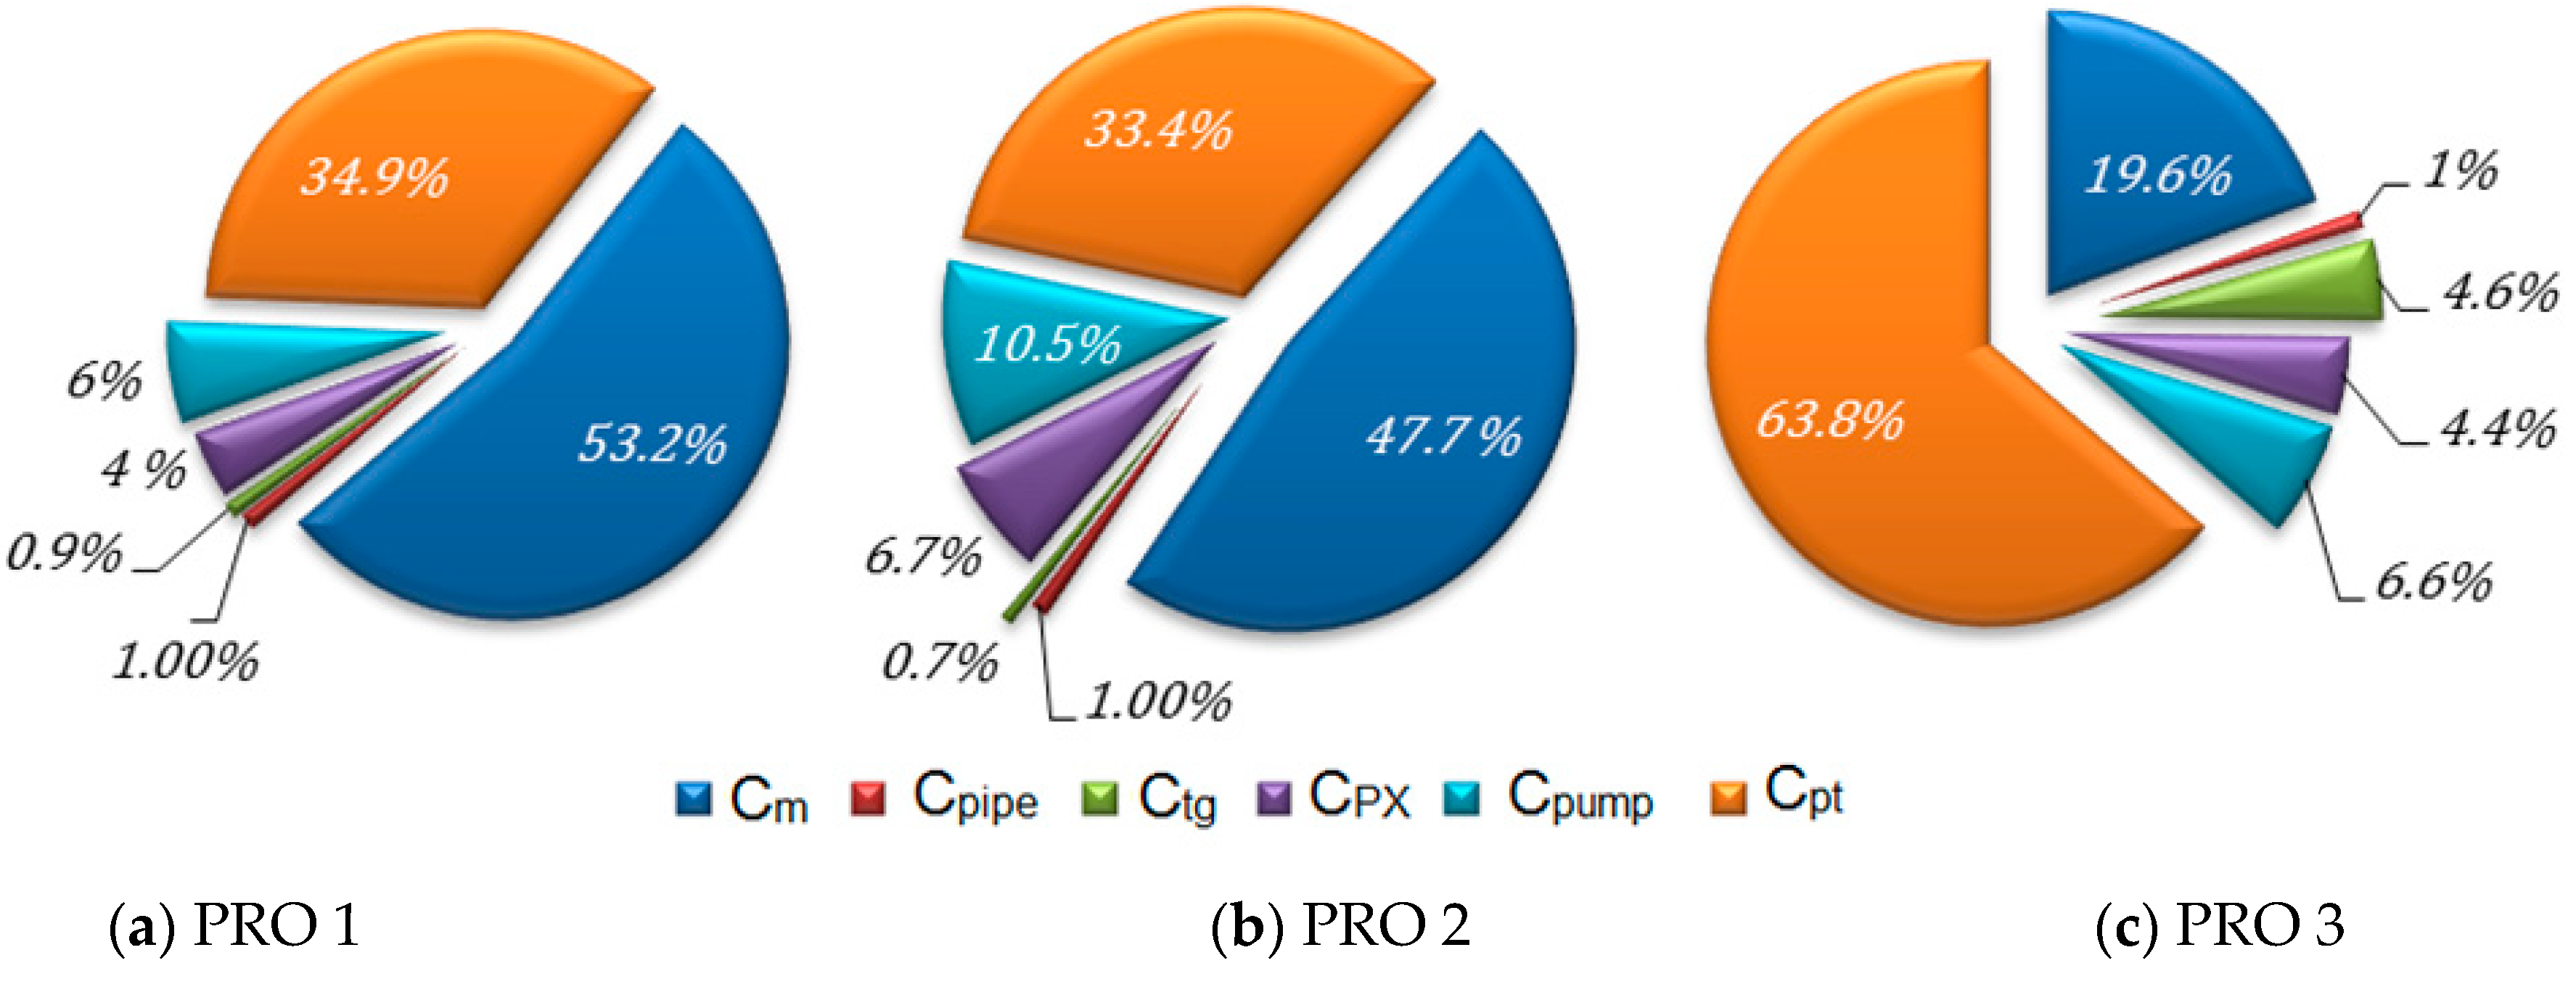
The capital costs of the systems used in PRO plants as a percentage of the total capital cost are shown in Figure 9. As indicated, for the first and second PRO plants, the major cost is the membrane system because of a low osmotic pressure difference compared to the third plant where the pretreatment system accounts for 63.8% of the total capital cost of the plant. Though, pre-treatment reduces fouling and sustains membrane performance for 7 to 10 years [14].
The membrane area calculated for the third PRO plant is a considerably large area. In such cases, some authors used a scale-up factor to reduce the capital cost of membrane. Loeb [21] used a 0.8 exponential scale-up cost factor, where the membrane cost reduced from 42 $/m2 to 18.6 $/m2.
Making a decision regarding an energy option is not made solely on the basis of its technical feasibility; the economic feasibility also plays a vital role. Economically, several methods can be used to determine the economic feasibility of any power generation project. The levelized cost of electricity (LCOE) is one of the best economic indicators that is used widely for decision-making. Calculating LCOE requires both fixed and variable costs. Fixed costs are the PRO investment cost and the variable cost indicates operation and maintenance cost.
LCOE is the main parameter to study the economic competitiveness of any electricity generation system. It represents the ratio of the total cost of the electricity generated to the total electric energy output ($/KWh) [45]. This is given using Equation (22):
Total cost of the electricity generated includes the capital cost and operation and maintenance cost of the plant during its life. For the calculation, the life of the plant N is assumed to be 20 years with an interest rate of 6% and is the energy generated per year (8760 h). The annual operation and maintenance cost consists of the membrane replacement cost, labor, and maintenance cost, which can be calculated using Equation (23).The expected membrane lifetime for a PRO plant is 5 years, and the maintenance and labor costs are estimated to be 2% and 1% of the total capital cost, respectively [46]. LCOE and operation and maintenance costs are shown in Table 8.
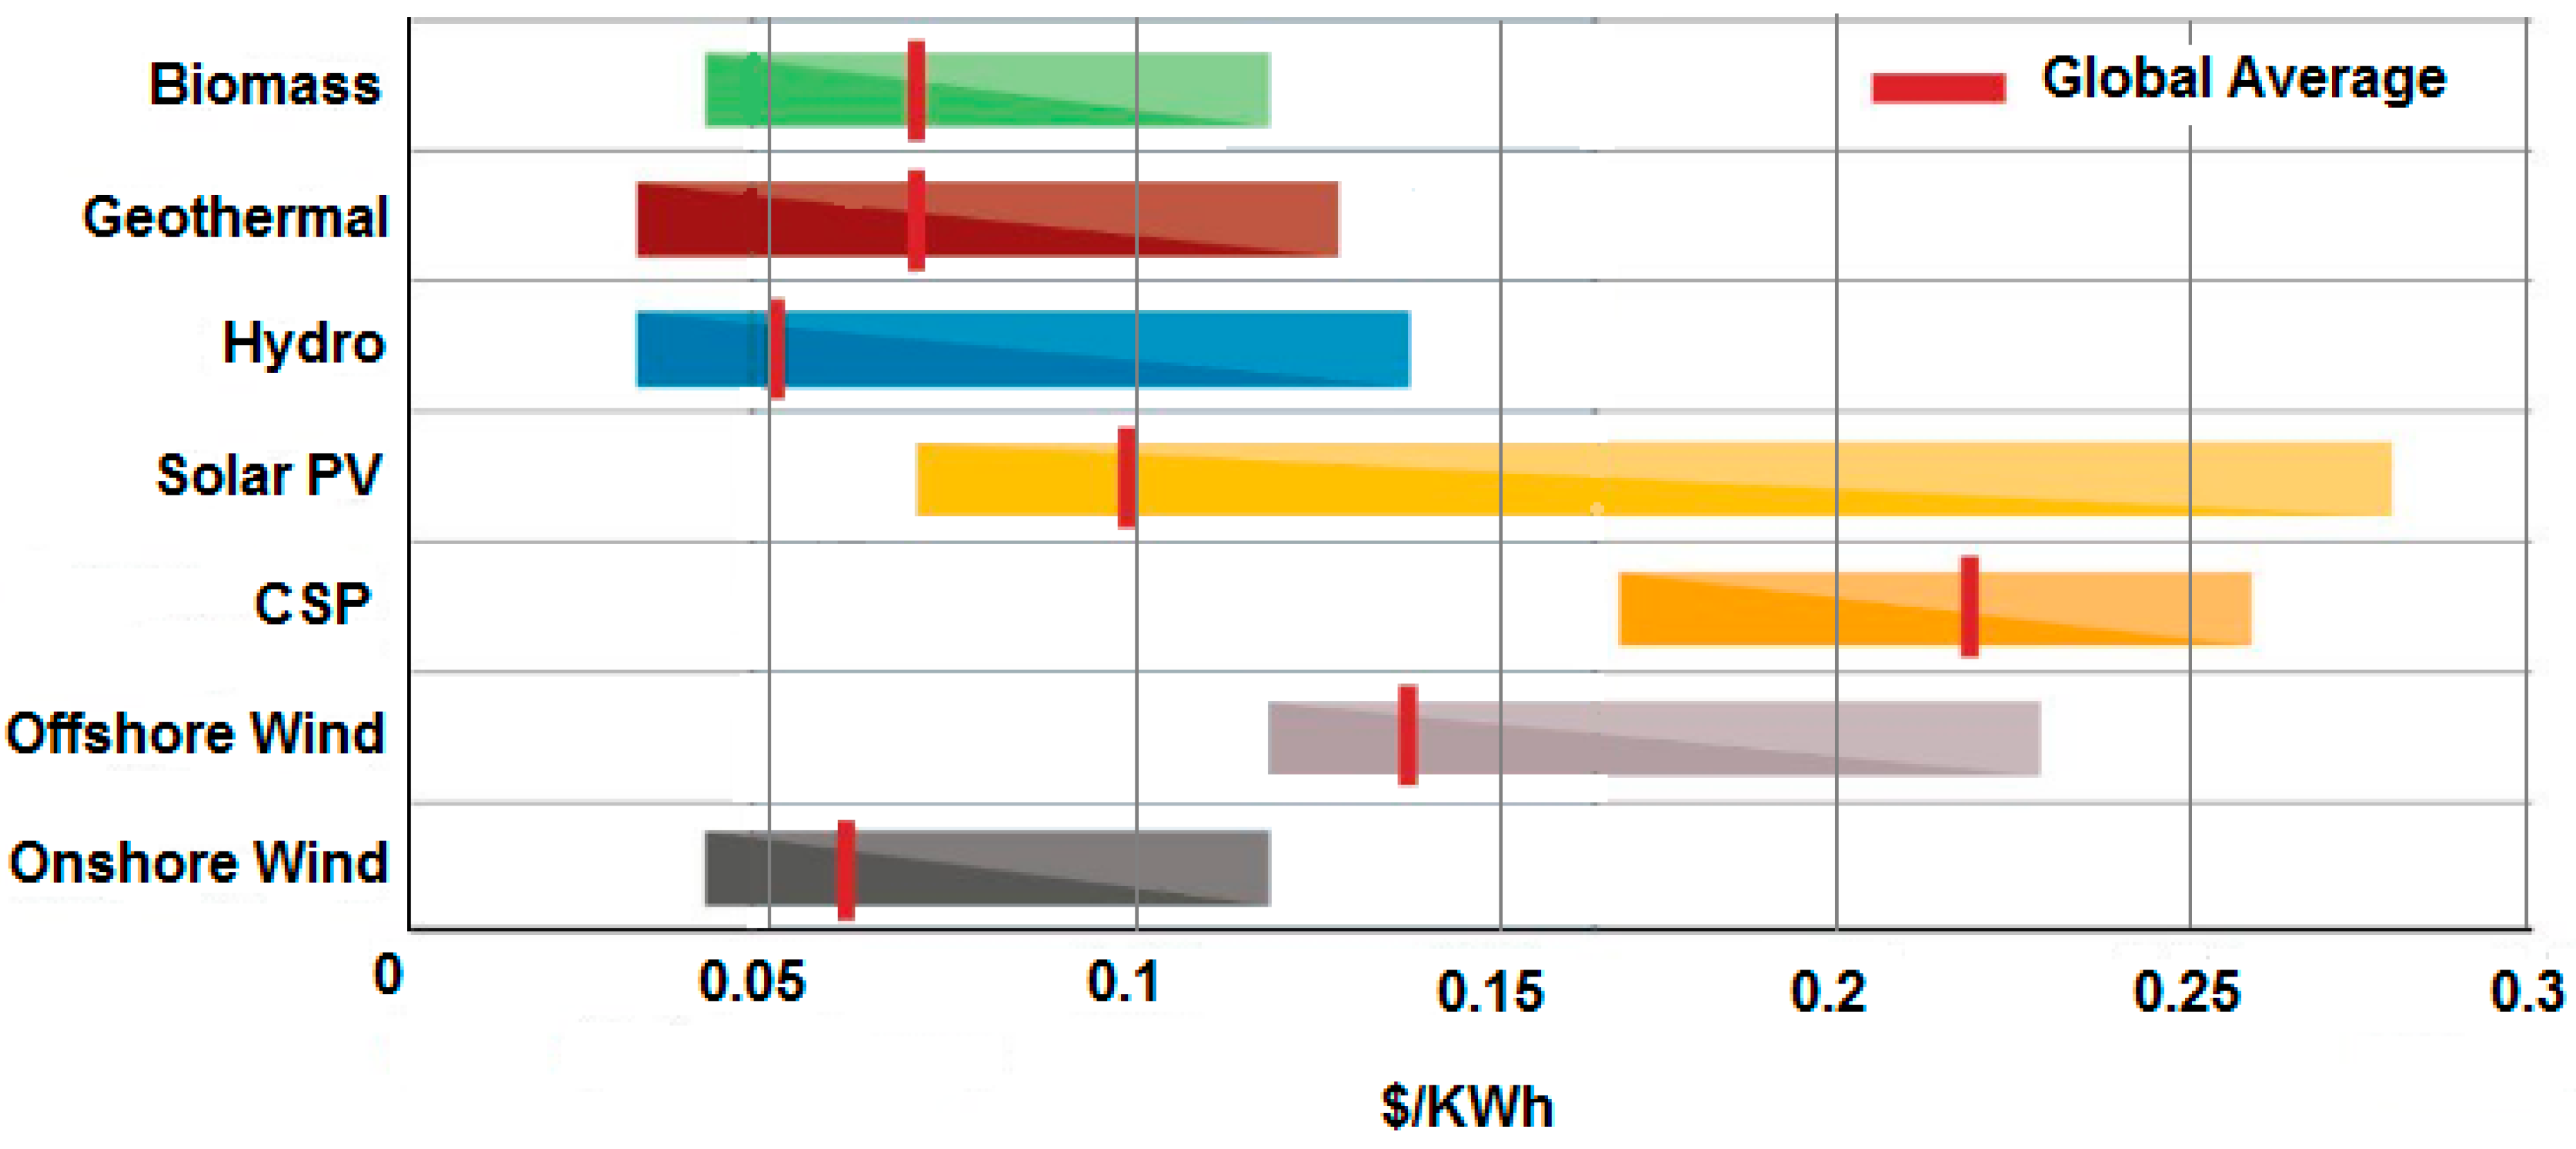
It can be seen that the first and second plants are not economically feasible, while the third PRO plant is highly competitive compared to other types of renewable energy sources, as indicated in Figure 10.
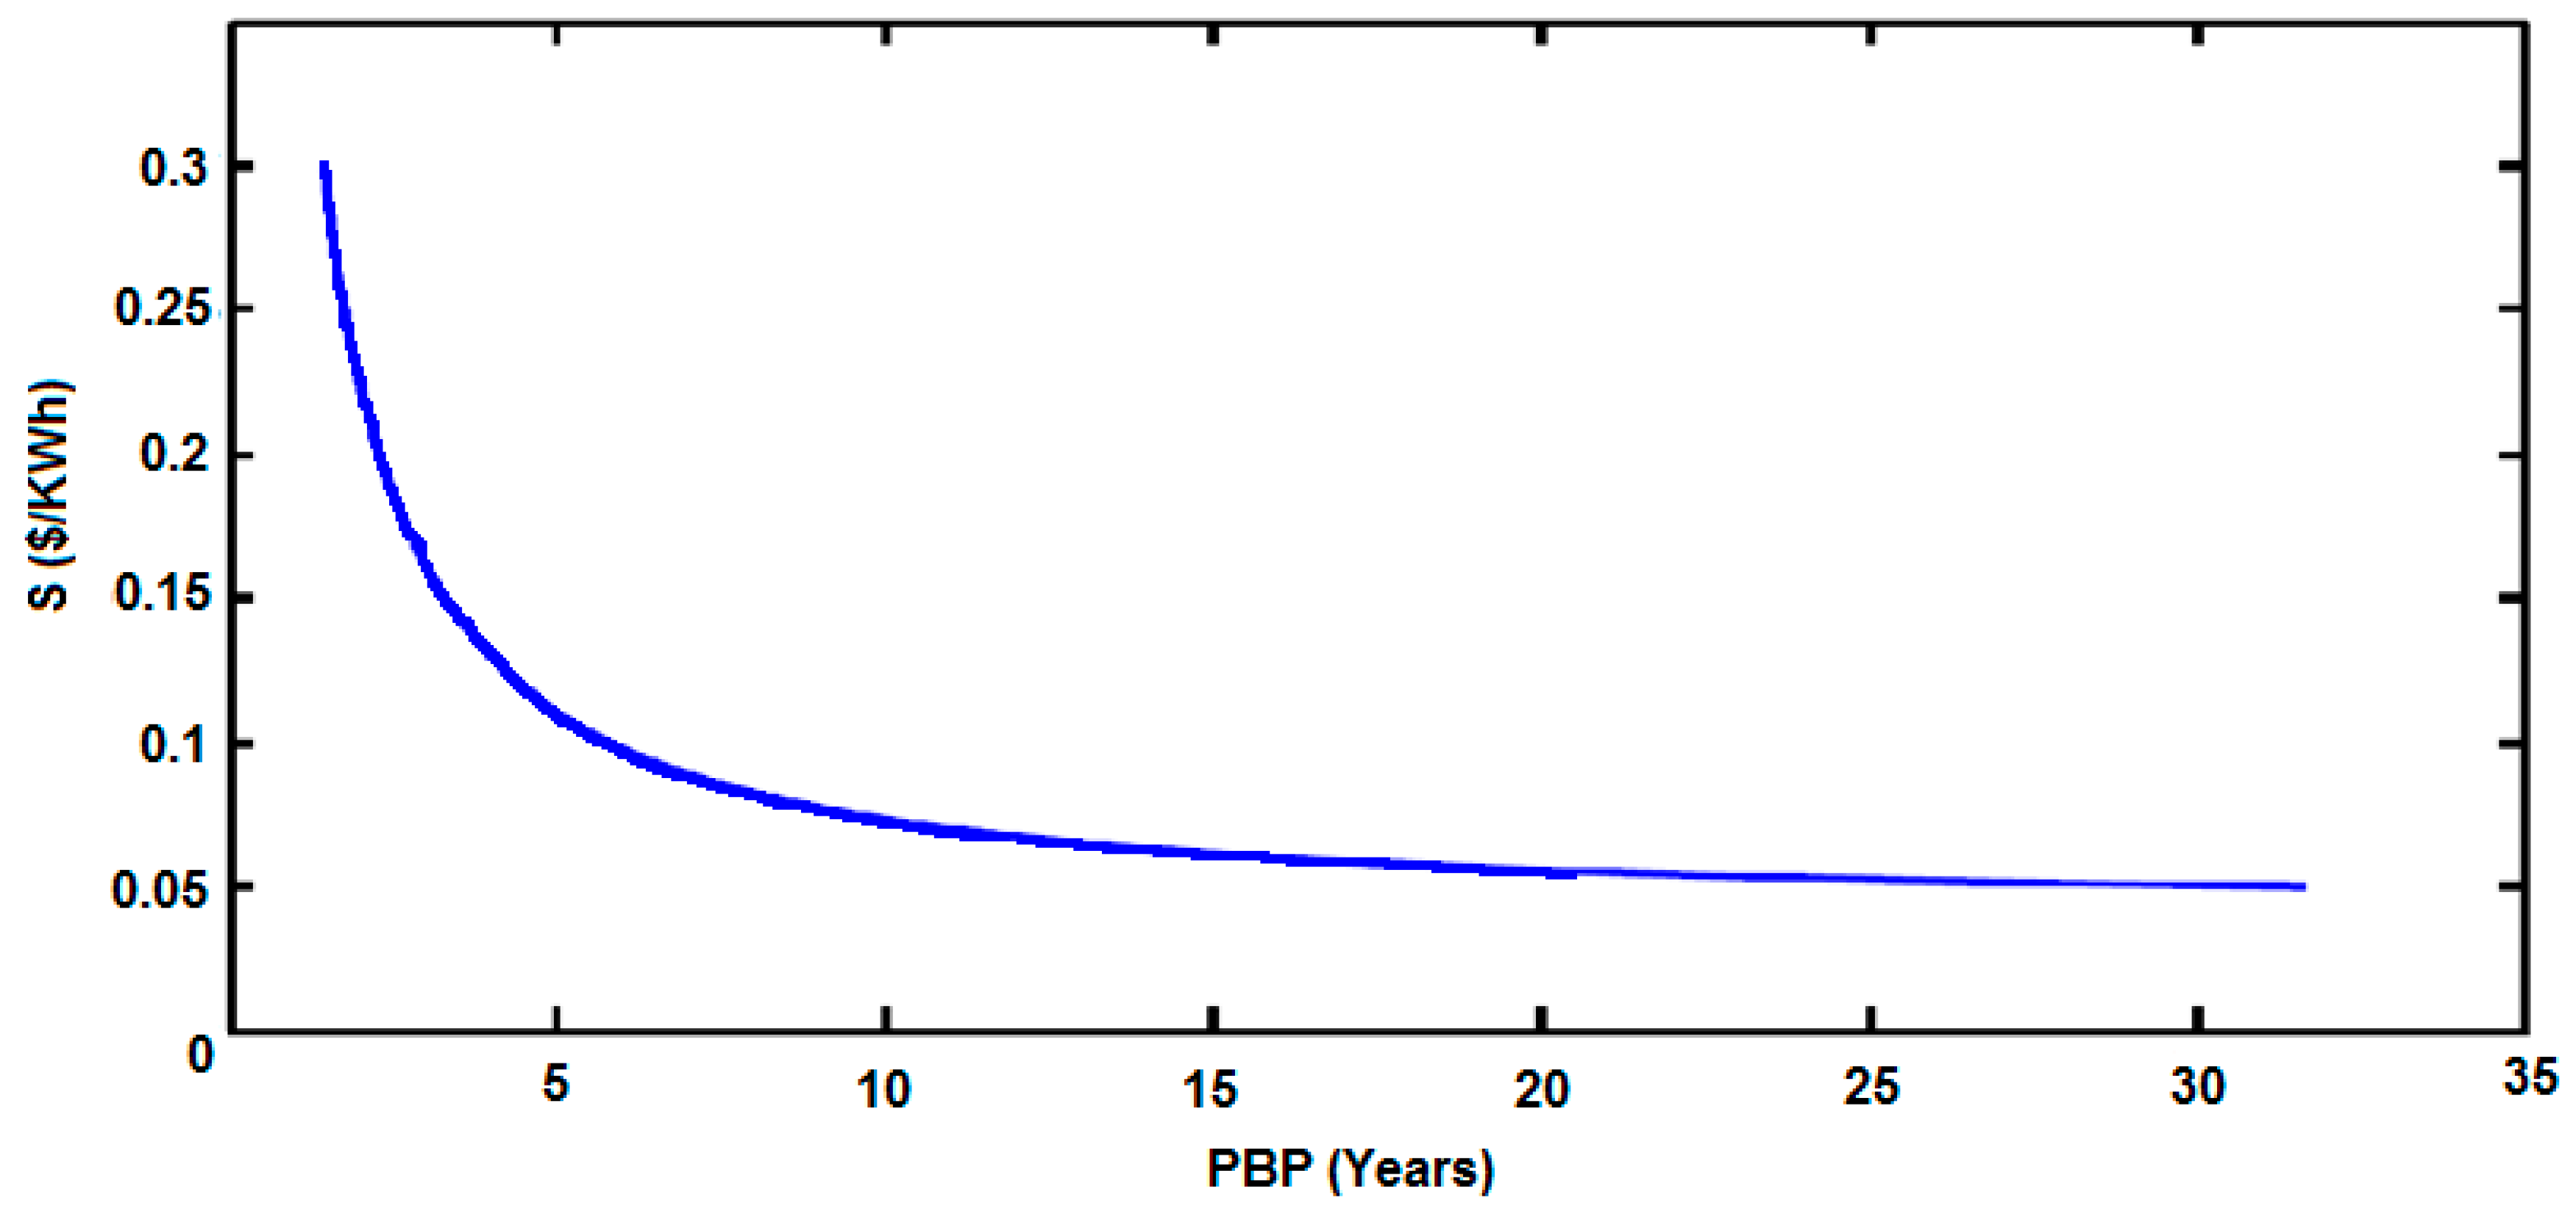
Other important criteria in deciding the economic merit of a project is the payback period (PBP). By rearranging Equation (22), can be obtained from Equation (24). Where S is the selling price of electricity:
Payback period (PBP) is an important economic indicator for the decision-making of a project, which consequently affects the selling price of electricity. According to renewable energy regulations in Jordan [47], the electricity selling price from renewable energy sources ranges between $0.08 for biogas and $0.19 from concentrated solar power for each KWh. Assuming a 0.135 $/KWh selling price for produced electricity from PRO, the PBP will be about 4 years. Figure 11 shows how the selling price of electricity affects the payback period of the third PRO plant.
The report of the RSDS project [26] estimated that the power needed for the project is 522 MW of electricity, and the SWRO-2 alone consumes 255.397 MW. The third PRO plant accounts for about 24.7% of the power needed for the project. According to the Jordan electricity tariff for the industrial sector, electricity costs for SWRO-2 are calculated to be 749,750,729 $/year. If the power generated from third PRO power plant is used to power SWRO-2, the electricity costs will be reduced to 380,215,732 $/year, making a save of about 49.3%. If the generated power from the PRO plant is sold to a national grid at a selling price of 0.135 $/KWh, the revenue is 159,059,700 $/year, saving about 21.2% of the electricity cost needed to power SWRO-2. Thus, using the power generated for project purposes is recommended from an economic point of view, which can significantly reduce the price of desalinated water produced from SWRO desalination plants.
4. Conclusions
In this work, three PRO power plants are proposed to be built on Red Sea–Dead Sea conveyance project RSDS. Draw solutions for the first two plants are the brine rejected from the SWRO desalination plants and the feed solutions are the Red Sea water flowing in the conveyer. The third PRO plant solution water is the Dead Sea water and the feed water is the water from conveyer. Calculated results show that all plants are technically feasible to generate power but only the third plant is economically feasible. The main reason is that this PRO power plant operates at a high osmotic pressure difference, which maximizes the power density and reduces the area of the membrane needed, as clearly shown in Table 6. The other reason is that no costs for the intake and outfall systems were calculated, which accounts for more than 60% of the total capital cost of the plant [14,42].
Economic indicators results for capital cost, LCOE, and payback period of an acceptable selling price of electricity showed that the PRO plant is highly competitive with other sources of renewable energy. Comparing the third PRO plant efficiency of 74.5% with other renewable energy power plants shows that the PRO plant has the highest efficiency after the hydroelectric power plants. The other technical advantage of PRO power plants over other types of renewable energy sources like wind and solar is the dispatchable generation, which can be controlled by using proper valves and controlling water flow. Furthermore, the PRO power plant capacity factor can reach 100% by maintaining a permeation rate of water and applied hydraulic pressure. This can be achieved by using a pre-treatment system and cleaning the membrane systematically.
This study also shows that there are other factors that affect the performance and cost of PRO power plants other than the membrane system, namely, the pumping system and pretreatment system. Since the third PRO plant accounts for about 24.7% of the power needed for the project, the power generated from the third PRO power plant can be used to power SWRO-2 in order to reduce the electricity costs by 49.3%. If the generated power from the third PRO plant is sold to the Jordanian national electricity grid at a selling price in accordance with Jordanian prices of electricity, a saving of about 21.2% can be attained. Thus, using the power generated for project purposes is recommended from an economic point of view, which can significantly reduce the price of desalinated water produced from SWRO desalination plants.
Author Contributions
Conceptualization, B.T.; Data curation, A.N. and B.K.; Formal analysis, A.N. and B.K.; Investigation, Q.K., A.N., and B.K.; Methodology, Q.K., A.N., and B.K.; Project administration, Q.K.; Resources, Q.K., A.N., and B.K.; Software, A.N. and B.K.; Supervision, Q.K.; Validation, Q.K. and A.N.; Visualization, Q.K. and A.N.; Writing—original draft, A.N. and B.K.; Writing—review and editing, Q.K. and B.T.
Funding
This research received no external funding.
Acknowledgments
The authors would like to acknowledge the Jordan University of Science and Technology for their continuous support of research and development.
Conflicts of Interest
The authors declare no conflict of interest.
References
- Logan, B.E.; Elimelech, M. Membrane-based processes for sustainable power generation using water. Nature 2012, 488, 313–319. [Google Scholar] [CrossRef] [PubMed]
- Veerman, J.; Saakes, M.; Metz, S.; Harmsen, G. Electrical Power from Sea and River Water by Reverse Electrodialysis: A First Step from the Laboratory to a Real Power Plant. Environ. Sci. Technol. 2010, 44, 9207–9212. [Google Scholar] [CrossRef] [PubMed]
- Pattle, R. Production of electric power by mixing fresh and salt water in the hydroelectric pile. Nature 1954, 174, 660. [Google Scholar] [CrossRef]
- Loeb, S.; Norman, R.S. Osmotic Power Plants. Science 1975, 189, 654–655. [Google Scholar] [CrossRef] [PubMed] [Green Version]
- Loeb, S. Production of energy from concentrated brines by pressure-retarded osmosis: I. Preliminary technical and economic correlations. J. Membr. Sci. 1976, 1, 49–63. [Google Scholar] [CrossRef]
- Loeb, S.; Van Hessen, F.; Shahaf, D. Production of energy from concentrated brines by pressure-retarded osmosis: II. Experimental results and projected energy costs. J. Membr. Sci. 1976, 1, 249–269. [Google Scholar] [CrossRef]
- Loeb, S.; Mehta, G.D. A two-coefficient water transport equation for pressure retarded osmosis. J. Membr. Sci. 1978, 4, 351–362. [Google Scholar] [CrossRef]
- Mehta, G.D.; Loeb, S. Internal polarization in the porous substructure of a semipermeable membrane under pressure-retarded osmosis. J. Membr. Sci. 1978, 4, 261–265. [Google Scholar] [CrossRef]
- Mehta, G.D.; Loeb, S. Performance of permasep B-9 and B-10 membranes in various osmotic regions and at high osmotic pressures. J. Membr. Sci. 1978, 4, 335–349. [Google Scholar] [CrossRef]
- Wang, P.; Chung, T. Recent advances in membrane distillation processes: Membrane development, configuration design and application exploring. J. Membr. Sci. 2015, 474, 39–56. [Google Scholar] [CrossRef]
- Ali Altaee, A.; Zou, J.; Alanezi, A.; Hawari, A. Osmotic Power Plant: Process Innovation and Future Potential. Recent Adv. Petrochem. Sci. 2018, 4, 555640. [Google Scholar] [CrossRef]
- O’Toole, G.; Jones, L.; Coutinho, C.; Hayes, C.; Napoles, M.; Achilli, A. River-to-sea pressure retarded osmosis: Resource utilization in a full-scale facility. Desalination 2016, 389, 39–51. [Google Scholar] [CrossRef] [Green Version]
- Sarp, S.; Li, Z.; Saththasivam, J. Pressure retarded osmosis (PRO): Past experiences, current developments, and future prospects. Desalination 2016, 389, 2–14. [Google Scholar] [CrossRef]
- Helfer, F.; Lemckert, C.; Anissimov, Y.G. Osmotic power with Pressure Retarded Osmosis: Theory, performance and trends—A review. J. Membr. Sci. 2014, 453, 337–358. [Google Scholar] [CrossRef]
- Yip, N.Y.; Elimelech, M. Performance limiting effects in power generation from salinity gradients by pressure retarded osmosis. Environ. Sci. Technol. 2011, 45, 10273–10282. [Google Scholar] [CrossRef] [PubMed]
- Sabah, M.; Atwan, A.; Mahood, H.; Sharif, A. Power generation based on pressure retarded osmosis: A design and an optimisation study. Int. J. Appl. Innov. Eng. Manag. (IJAIEM) 2013, 2, 68–74. [Google Scholar]
- Chung, H.; Banchik, L.; Swaminathan, J.; Lienhard, J. On the present and future economic viability of stand-alone pressure retarded osmosis. Desalination 2017, 408, 133–144. [Google Scholar] [CrossRef]
- Helfer, F.; Sahin, O.; Lemckert, C.; Anissimov, Y. Salinity gradient energy: A new source of renewable energy for Australia. In Proceedings of the 8th International Conference of the European Water Resources Association, EWRA, Porto, Portugal, 26–29 June 2013. [Google Scholar]
- Kim, Y.C.; Elimelech, M. Potential of osmotic power generation by pressure retarded osmosis using seawater as feed solution: Analysis and experiments. J. Membr. Sci. 2013, 429, 330–337. [Google Scholar] [CrossRef]
- Kelada, M. Global Potential of Hypersalinity Osmotic Power; MIK Technology: Houston, TX, USA, 2010. [Google Scholar]
- Loeb, S. Energy production at the Dead Sea by pressure-retarded osmosis: Challenge or chimera? Desalination 1998, 120, 247–262. [Google Scholar] [CrossRef]
- Loeb, S. One hundred and thirty benign and renewable megawatts from Great Salt Lake? The possibilities of hydroelectric power by pressure-retarded osmosis. Desalination 2001, 141, 85–91. [Google Scholar] [CrossRef]
- DOW™ Specialty Membranes XUS180808 Ultra-High Pressure RO Element. 2018. Available online: https://www.dow.com/en-us/markets-and-solutions/products/DOWSpecialtyMembranes/DOWSpecialtyMembranesXUS180808UltraHighPressureROElement (accessed on 14 October 2018).
- Efraty, A. Pressure retarded osmosis in closed circuit: A new technology for clean power generation without need of energy recovery. Desalin. Water Treat. 2013, 51, 7420–7430. [Google Scholar] [CrossRef]
- World Bank. Red Sea—Dead Sea Water Conveyance Study Program, Dead Sea Study, Final Report; Report No.: GSI/10/2011; The World Bank: Washington, DC, USA, 2011. [Google Scholar]
- Jordan Valley Authority. Jordan Red Sea Project-Project Summary; WD 05 JRSP; Ministry of Water and Irrigation: Amman, Jordan, 2011.
- Zhao, S.; Zou, L.; Tang, C.; Mulcahy, D. Recent developments in forward osmosis: Opportunities and challenges. J. Membr. Sci. 2012, 396, 1–21. [Google Scholar] [CrossRef]
- Graham, E.; Baktian, N.; Camacho, L.; Chellam, S.; Mroue, A.; Sperling, J.; Topolski, K.; Xu, P. Energy for Water and Desalination. Curr. Sustain. Renew. Energy Rep. 2017, 4, 109–116. [Google Scholar] [CrossRef]
- Kelada, M. How Are Osmotic Pressure and Power Calculated? MIK Technology: Houston, TX, USA, 2010. [Google Scholar]
- Al-whoosh, K.; Mohammad Aljaradin, M.; Bashitialshaaer, R.; Balawneh, H. Establishing Small-Scale Salt-Gradient Solar Pond Experiment, Dead Sea Jordan. Sustain. Resour. Manag. J. 2017, 2, 1–10. [Google Scholar]
- Han, G.; Zhang, S.; Li, X.; Chung, T. Progress in pressure retarded osmosis (PRO) membranes for osmotic power generation. Prog. Polym. Sci. 2015, 51, 1–27. [Google Scholar] [CrossRef]
- Yip, N.Y.; Tiraferri, A.; Phillip, W.A.; Schiffman, J.D.; Hoover, L.A.; Kim, Y.C.; Elimelech, M. Thin-Film Composite Pressure Retarded Osmosis Membranes for Sustainable Power Generation from Salinity Gradients. Environ. Sci. Technol. 2011, 45, 4360–4369. [Google Scholar] [CrossRef] [PubMed]
- McCutcheon, J.R. Modified Reverse Osmosis Membranes for Forward and Pressure Retarded Osmosis; National Science Foundation (NSF) Grant, Application Number 1160098; National Science Foundation (NSF): Alexandria, VA, USA, 2012.
- Abdel-Fatah, M.; Elsayed, M.; Al Bazedi, G. Design of Reverse Osmosis Desalination Plant in Suez City (Case Study). J. Sci. Eng. Res. 2016, 3, 149–156. [Google Scholar]
- Williamson, S.J.; Stark, B.H.; Booker, J.D. Low head pico hydro turbine selection using a multi-criteria analysis. Renew. Energy 2014, 61, 43–50. [Google Scholar] [CrossRef]
- Liu, X.; Luo, Y.; Karney, B.W.; Wang, W. A selected literature review of efficiency improvements in hydraulic turbines. Renew. Sustain. Energy Rev. 2015, 51, 18–28. [Google Scholar] [CrossRef]
- Staubli, T.; Abgottspon, A.; Weibel, P. Jet quality and Pelton efficiency. In Proceedings of the Hydro 2009 Progress–Potential–Plans, Lyon, France, 26–28 October 2009. [Google Scholar]
- Peñate, B.; García-Rodríguez, L. Energy optimisation of existing SWRO (seawater reverse osmosis) plants with ERT (energy recovery turbines): Technical and thermoeconomic assessment. Energy 2011, 36, 613–626. [Google Scholar] [CrossRef]
- Sim, V.; She, Q.; Chong, T.; Tang, C. Strategic co-location in a hybrid process involving desalination and pressure retarded osmosis (PRO). Membranes 2013, 3, 98–125. [Google Scholar] [CrossRef] [PubMed] [Green Version]
- Zhang, B.; Ma, J.; Hong, H.; Yang, H.; Fang, Y. Analysis of the flow dynamics characteristics of an axial piston pump based on the computational fluid dynamics method. Eng. Appl. Comput. Fluid Mech. 2017, 11, 86–95. [Google Scholar] [CrossRef]
- Kleiterp, R. The Feasibility of a Commercial Osmotic Power Plant. Master’s Thesis, Delft University of Technology, Delft, The Netherlands, 2012. [Google Scholar]
- Naghiloo, A.; Abbaspour, M.; Mohammadi-Ivatloo, B.; Bakhtari, K. Modeling and design of a 25 MW osmotic power plant (PRO) on Bahmanshir River of Iran. Renew. Energy 2015, 78, 51–59. [Google Scholar] [CrossRef]
- Jaber, J.O.; Elkarmi, F.; Alasis, E.; Kostas, A. Employment of renewable energy in Jordan: Current status, SWOT and problem analysis. Renew. Sustain. Energy Rev. 2015, 49, 490–499. [Google Scholar] [CrossRef]
- International Renewable Energy Agency (IRENA). Renewable Power Generation Costs in 2017; International Renewable Energy Agency: Abu Dhabi, UAE, 2018. [Google Scholar]
- Günther, M.; Alsen, N. Advanced CSP Teaching Materials, Chapter 15: Economical Aspects; German Aerospace Center (DLR): Köln-Porz, Germany, 2011.
- Ziolkowska, J.R. Is desalination affordable?—Regional cost and price analysis. Water Resour. Manag. 2015, 29, 1385–1397. [Google Scholar] [CrossRef]
- Jordan Energy and Minerals Regulatory Commission. Electricity Regulatory Sector, Electricity Tarrif. 2016. Available online: http://emrc.gov.jo/index.php/en/electricity-tariff (accessed on 15 May 2015).
Figure 1.
Predicted Dead Sea levels for different intake volumes [26].
Figure 1.
Predicted Dead Sea levels for different intake volumes [26].

Figure 2.
Schematic of Red Sea—Dead Sea Conveyance Project and amounts of annual flow rates.

Figure 3.
Schematic diagram of power production from PRO power plant.

Figure 4.
Flow diagram of the proposed RSDS project with three proposed PRO plants (RSDS infrastructure with distance and elevation [26]).
Figure 4.
Flow diagram of the proposed RSDS project with three proposed PRO plants (RSDS infrastructure with distance and elevation [26]).

Figure 5.
Flow chart of the flow streams for the proposed RSDS project and the three proposed PRO plants. (Flow rates are shown beside arrows [26]. All flow rates are in MCM/year).
Figure 5.
Flow chart of the flow streams for the proposed RSDS project and the three proposed PRO plants. (Flow rates are shown beside arrows [26]. All flow rates are in MCM/year).

Figure 6.
Schematic illustration of the concentration polarization profile for a typical membrane under PRO mode [32].
Figure 6.
Schematic illustration of the concentration polarization profile for a typical membrane under PRO mode [32].

Figure 7.
Percentage of the different power losses and net power production from the three PRO power plants.
Figure 7.
Percentage of the different power losses and net power production from the three PRO power plants.

Figure 8.
Typical ranges and weighted averages for the total capital costs of renewable power generation technologies (2017) [44].
Figure 8.
Typical ranges and weighted averages for the total capital costs of renewable power generation technologies (2017) [44].

Figure 9.
Percentage of capital costs for three PRO power plants.

Figure 10.
The levelized cost of electricity (LCOE) of renewable power generation technologies and their weighted average (2017) [44].
Figure 10.
The levelized cost of electricity (LCOE) of renewable power generation technologies and their weighted average (2017) [44].

Figure 11.
Payback period as a function of the selling price of electricity for PRO-3.


Table 1.
Dead Sea salt composition [30].
Table 1.
Dead Sea salt composition [30].
| Salt | Φ | I | Mass Composition (g/L) | Molar Weight (g/mol) | c (mol/L) | Φ*I*c |
|---|---|---|---|---|---|---|
| NaCl | 0.93 | 2 | 91.8 | 58.44 | 1.55 | 2.883 |
| CaCl2 | 0.86 | 3 | 52.4 | 111 | 0.47 | 1.2126 |
| MgCl2 | 0.89 | 3 | 190.2 | 95.2 | 1.995 | 5.3266 |
| KCl | 0.92 | 2 | 15.9 | 74.55 | 0.2132 | 0.3922 |
Table 2.
Data for the three proposed PRO power plants.
| Parameter | PRO 1 | PRO 2 | PRO 3 |
|---|---|---|---|
| VF (m3/s) | 2.5368 | 11.7326 | 38.685 |
| VD (m3/s) | 2.5368 | 12 | 40 |
| ΔV (m3/s) | 1.2684 | 6 | 20 |
| πD (bar) | 67.5 | 70.1 | 240 |
| πF (bar) | 34.4 | 35.04 | 59.4 |
Table 3.
Selected membrane properties [15].
Table 3.
Selected membrane properties [15].
| Intrinsic Water Permeability A (L/m2·h·bar) | Solute Permeability Coefficient B (L/m2·h) | Max Operating Pressure (bar) | Salt Rejection R (%) | /Element (bar) | Feed Solution Concentration (ppm) | Cost $/m2 |
|---|---|---|---|---|---|---|
| 7.70 0.34 | 7.67 0.49 | 93 | 86.4 2.4 | 1 | 3000 | ≈25 |
Table 4.
Calculated membrane parameters and cost for the three PRO plants.
| Parameter | PRO 1 | PRO 2 | PRO 3 |
|---|---|---|---|
| Ph (bar) | 16.55 | 17.53 | 90.3 |
| Wmax (W/m2) | 1.97 | 2.2 | 58.7 |
| (L/m2·h) | 4.3 | 4.5 | 23.4 |
| am (m2) | 1,064,500 | 4,753,800 | 3,076,200 |
| Cm ($) | 26,611,000 | 118,840,000 | 76,904,000 |
| PWmax (MW) | 2.1 | 10.52 | 180.6 |
| PWL_m (MW) | 0.51 | 2.4 | 8 |
Table 5.
Turbine-generator set parameters.
| Parameter | PRO 1 | PRO 2 | PRO 3 |
|---|---|---|---|
| Vt (m3/s) | 1.2684 | 1 | 1 |
| ntg (−) | 1 | 6 | 20 |
| (m) | 118 | 128 | 870.4 |
Table 6.
PRO power plants power generation capacities and losses.
| PRO Plant | MW | MW | MW | MW | MW | MW | E GWh/Year | η % |
| First | 2.1 | 0.51 | 0.105 | 1.04 | 0.15 | 0.295 | 2.584 | 14 |
| Second | 10.52 | 2.4 | 0.526 | 4.2 | 0.712 | 2.682 | 23.494 | 25.5 |
| Third | 180.6 | 8 | 9.03 | 26.71 | 2.36 | 134.5 | 1178.22 | 74.5 |
Table 7.
Cost calculations of the three PRO power plants.
| PRO Plant | Cm $ | $ | $ | $ | $ | $ | $ | $/KW |
|---|---|---|---|---|---|---|---|---|
| First | 26,611,000 | 554,276 | 389,567 | 3,925,177 | 5,867,548 | 18,080,118 | 55,427,626 | 187,890 |
| Second | 118,840,000 | 2,319,043 | 2,148,089 | 9,667,148 | 14,357,326 | 84,572,734 | 231,904,340 | 86,466 |
| Third | 76,904,000 | 4,299,704 | 20,159,786 | 19,434,263 | 28,773,362 | 280,399,348 | 429,970,463 | 3196 |
Table 8.
Operation and maintenance costs and LCOE.
| PRO Plant | Membrane Replacement ($/Year) | Maintenance Cost ($/Year) | Labor Cost ($/Year) | ($/Year) | LCOE ($/KWh) |
|---|---|---|---|---|---|
| First | 5,322,200 | 1,108,552 | 554,276 | 6,985,028 | 4.57 |
| Second | 23,768,000 | 4,638,087 | 2,319,043 | 30,725,130 | 2.16 |
| Third | 15,380,800 | 8,599,409 | 4,299,704 | 28,279,913 | 0.056 |
© 2018 by the authors. Licensee MDPI, Basel, Switzerland. This article is an open access article distributed under the terms and conditions of the Creative Commons Attribution (CC BY) license (http://creativecommons.org/licenses/by/4.0/).
Share and Cite
MDPI and ACS Style
Khasawneh, Q.A.; Tashtoush, B.; Nawafleh, A.; Kan’an, B. Techno-Economic Feasibility Study of a Hypersaline Pressure-Retarded Osmosis Power Plants: Dead Sea–Red Sea Conveyor. Energies 2018, 11, 3118. https://doi.org/10.3390/en11113118
AMA Style
Khasawneh QA, Tashtoush B, Nawafleh A, Kan’an B. Techno-Economic Feasibility Study of a Hypersaline Pressure-Retarded Osmosis Power Plants: Dead Sea–Red Sea Conveyor. Energies. 2018; 11(11):3118. https://doi.org/10.3390/en11113118
Chicago/Turabian StyleKhasawneh, Qais A., Bourhan Tashtoush, Anas Nawafleh, and Bayan Kan’an. 2018. "Techno-Economic Feasibility Study of a Hypersaline Pressure-Retarded Osmosis Power Plants: Dead Sea–Red Sea Conveyor" Energies 11, no. 11: 3118. https://doi.org/10.3390/en11113118
Note that from the first issue of 2016, this journal uses article numbers instead of page numbers. See further details here.